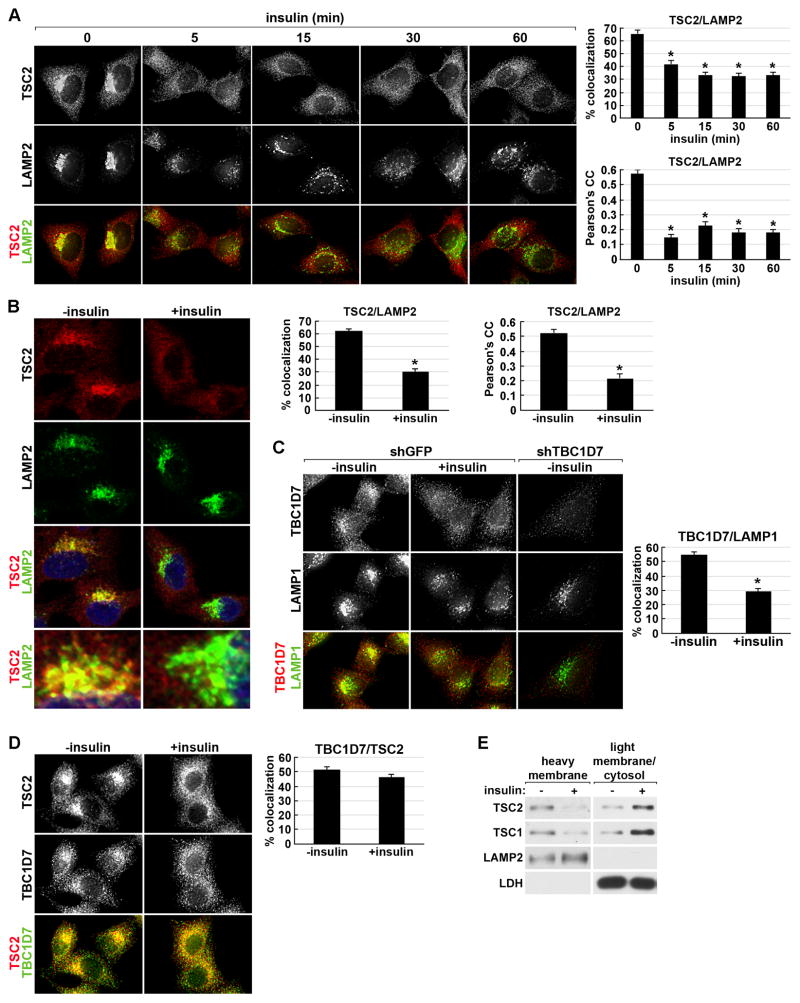
Figure 2. Insulin acutely disrupts the lysosomal localization of the TSC complex.
(A) HeLa cells were serum starved then stimulated with a time course of insulin prior to immunofluorescent labeling of endogenous TSC2 (red) and LAMP2 (green). Representative cells are shown where yellow or orange pixels indicate colocalization in the merged images. Percent colocalization and Pearson’s Correlation Coefficient (PCC) are graphed as a mean±SEM (right). *p< 1X10⁻⁶ (% colocalization) and *p< 1X10⁻¹² (PCC), compared to unstimulated (0 min).
(B) Cells were treated and labeled as in (A), but with a single 15-min insulin stimulation, and imaged by confocal microscopy. An enlarged view of the LAMP2-containing compartment from the bottom cells in the two images is shown below. Percent colocalization and PCC are presented as in (A). *p< 1X10⁻¹³ (% colocalization) and *p< 1X10⁻¹⁰ (PCC) compared to unstimulated (0 min).
(C) HeLa cells stably expressing a control shRNA (shGFP) or one targeting TBC1D7 (shTBC1D7) were treated as in (B) and labeled for TBC1D7 (red) and LAMP1 (green). Representative cells are shown and percent colocalization is presented as in (A). *p< 1X10⁻¹⁰.
(D) Cells treated as in (B) were labeled for TSC2 (red) and TBC1D7 (green), with percent colocalization presented as in (A).
(E) Cells treated as in (B) and lysates were separated into heavy membrane and light membrane/cytosolic fractions.

