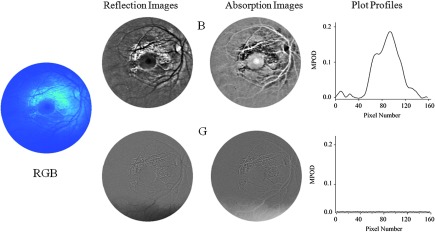
Fig. 4.

Fundus imaging of infant of Fig. 3 with blue-light excitation. Left: raw image obtained with combined RGB chip readouts of CCD detector array. First column: reflection images derived from raw image via selective B- and G-chip readouts, respectively, and subsequent FFT filtering (same settings as for Fig. 3). Second column: B and G absorption images derived from reflection images. Right column: MPOD line profiles obtained along meridians running horizontally through the center of the macula. Note that the MPOD level of in the center of the MP distribution is about twice as high as the level obtained with white-light excitation (shown in Fig. 3).
