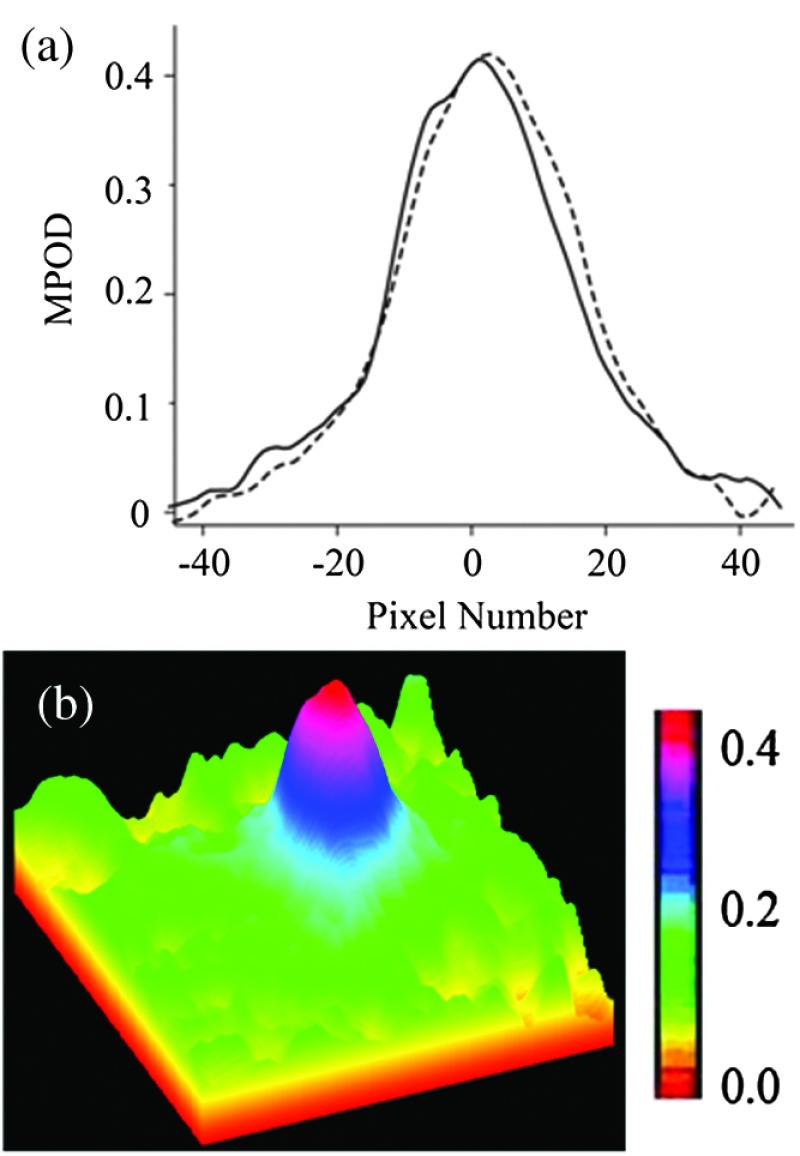
Fig. 6.
Spatial features of MP distributions obtained via processing of two-dimensional grayscale raw image pixel intensity maps: (a) MP profiles along the nasal–temporal (solid curve) and inferior–superior meridians (dashed curve); and (b) pseudocolor-scaled three-dimensional MP distribution with corresponding scale bar.

