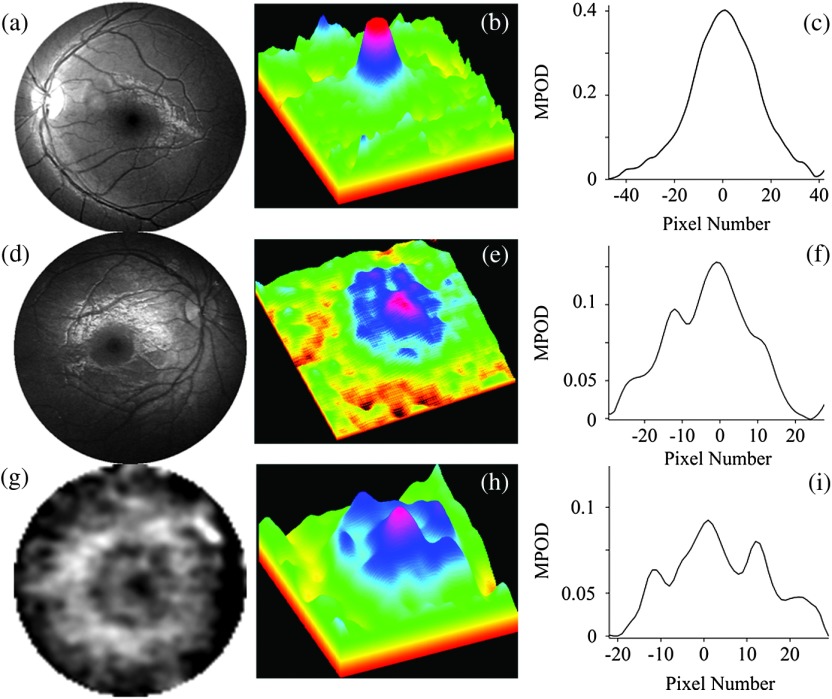
Fig. 8.
Reflection-based MP images for three infants and their corresponding spatial MP distributions. Gray-scaled images centered on the macula in each case for infants aged 3 (a), 0.5 (d) and 0.6 (g) years, respectively. Corresponding pseudocolor-scaled, three-dimensional MP distributions (b), (e), and (h). Corresponding spatial MPOD plot profiles along the nasal–temporal axes (c), (f) and (i). Most subjects participating in this study revealed narrow, nearly circularly symmetric MP distributions similar to (a), (b, (c), but they differed generally in peak MP levels. Two subjects revealed MP distributions similar to (g), (h), (i), characterized by a strong MP peak in the fovea surrounded by lower MP levels over a concentric ring. Image (g) is enlarged about 5 times relative to images (a) and (b).

