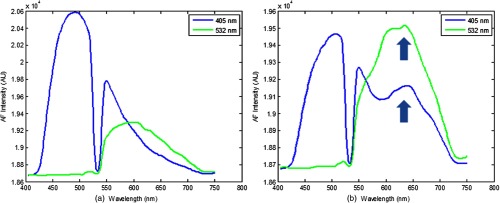
Fig. 8.

Typical AF emission spectra recorded from sound (a) and demineralized (b) enamel. The valley on the 405-nm emission curve at 532 nm is a result of the in-line 532-nm rejection filter. In (b), there is increased contribution from the bacterial fluorescence, which manifests as a hump-like feature centered around 635 nm in the 405-nm excited AF. The 532-nm emission curve is shifted further out toward red compared to the 405-nm emission curve. Since the bacterial fluorescence is centered around 635 nm, the superposition of the 532-nm curve with the bacterial fluorescence curve leads to stronger fluorescence from the 532-nm emission curve compared to the 405-nm emission curve from to 650 nm.
