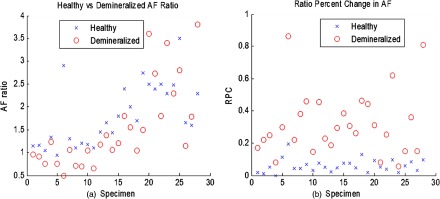
Fig. 9.

(a) 405/532-nm AF ratios obtained from both healthy and demineralized regions for each specimen. In all cases, healthy enamel exhibited higher AF ratio than demineralized ratios. However, significant interspecimen variations are seen. When changed to RPC in AF ratio compared to a baseline AF ratio for each tooth (b), the delineation between healthy and demineralized enamel becomes more distinct.
