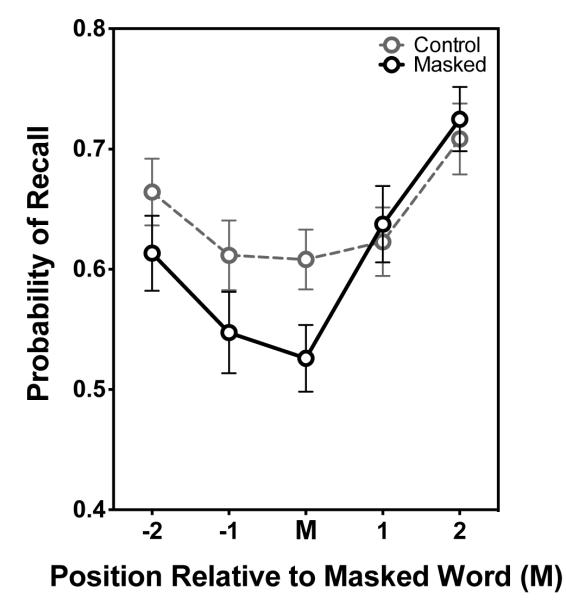
Figure 1.
Lower curve shows the probability of recall of an acoustically masked word (M), the two words preceding the masked word (−1, −2), and the two words following the masked word (+1, +2). The upper curve shows the probability of recall for words in analogous positions in a control list in which no words were masked. Lists comprised 7 items, presented at a rate of 1500 ms per word, and the position of the masked word varied from list to list. Error bars are one standard error. (Data from Piquado et al., 2010).

