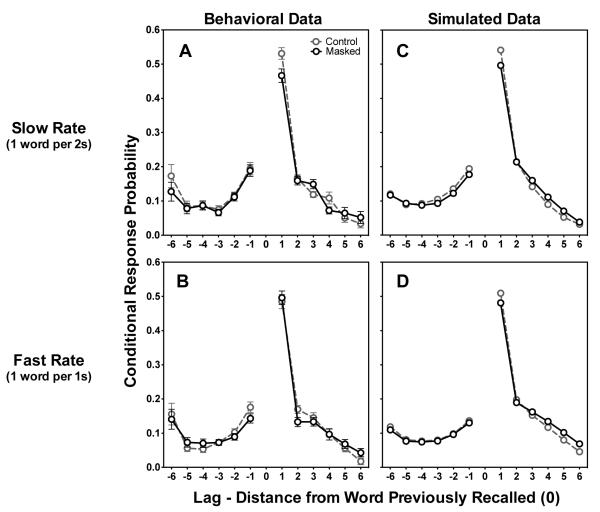
Figure 4.
Figures 4A and 4B show Lag-CRP functions for behavioral data for the masked and control conditions for the slower and faster presentation rates respectively. Figures 4C and 4D show simulation results for the slower and faster presentation rates respectively. Error bars represent one standard error. Error bars that do not appear were too small to plot.

