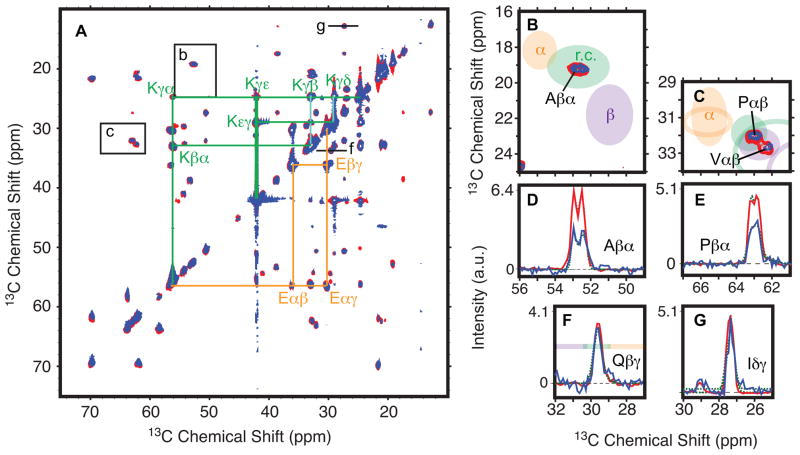
Figure 3.
Weak prion fibers have more dynamic residues than strong prion fibrils. (a) Two-dimensional 13C-13C INEPT-TOBSY for the strong (blue) and weak (red) prion fiber forms of uniformly 13C, 15N-labeled NM. Spin systems for lysine and glutamic acid are connected in green and orange, respectively. (b and c) Expansions from a. Ellispes indicate the average chemical shift for alpha helical (orange), random coil (green) and beta sheet (purple) secondary structures. While the positions of the peaks in a are identical, the intensities of the peaks vary. (d–e) One-dimensional slices through the cross peaks in b and c fit to two Gaussians (dotted line). These cross-peaks show 60 Hz of line splitting from C′-Cα J-coupling. (f–g) However, intensities for some sites are identical. One-dimensional slices at positions indicated in a with Gaussian fits (dotted lines). Results of the quantification for both fiber types are reported in Table 1. See also Figure S2 and Table S1.

