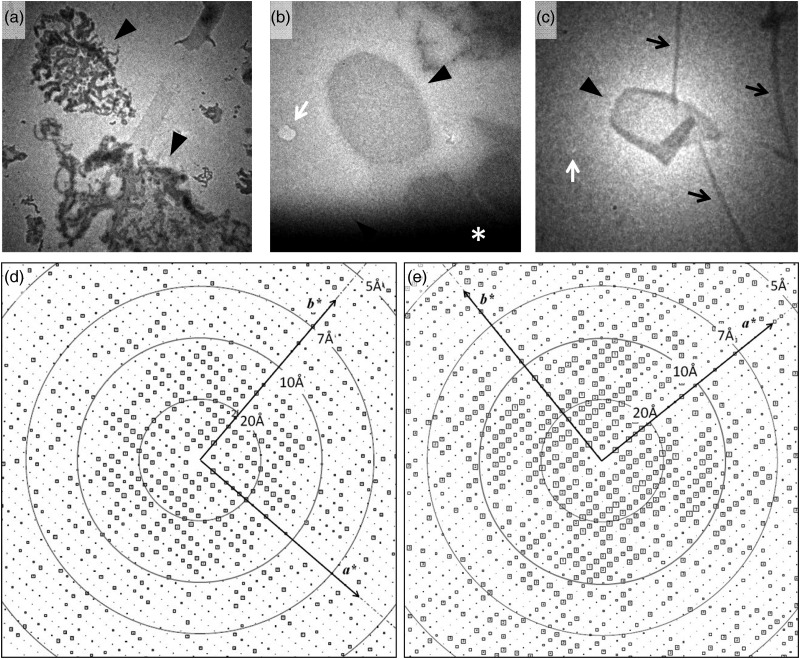
Fig. 2.
Comparison of the analyzed image quality between carbon sandwich and single carbon support film preparations. (a–c) Low magnification images (search mode) of H+,K+-ATPase 2D crystals (arrowheads) in frozen specimens prepared by the single carbon method (a and b) or carbon sandwich method (c). Most of the crystals embedded in the thin ice are dehydrated in the single carbon preparation (a), while preserved crystals can be found in the thicker ice area at the edge of the grid well (*: dark area) in some cases (b). In the carbon sandwich preparation, preserved 2D crystals are distributed evenly over the grid well (c). White arrows indicate the position used for focusing the image, and black arrows indicate crinkling of the carbon membrane, which usually occurs in carbon sandwich preparations. Because all images herein were obtained using a low-dose defocused diffraction mode, the mean diameter of ∼2 μm for sheet crystals is used for approximate scaling. (d and e) IQ-plot calculated from a non-tilted image of H+,K+-ATPase single sheet crystal in the E2AlF conformation prepared by the single carbon support film (d) and carbon sandwich (e) techniques.

