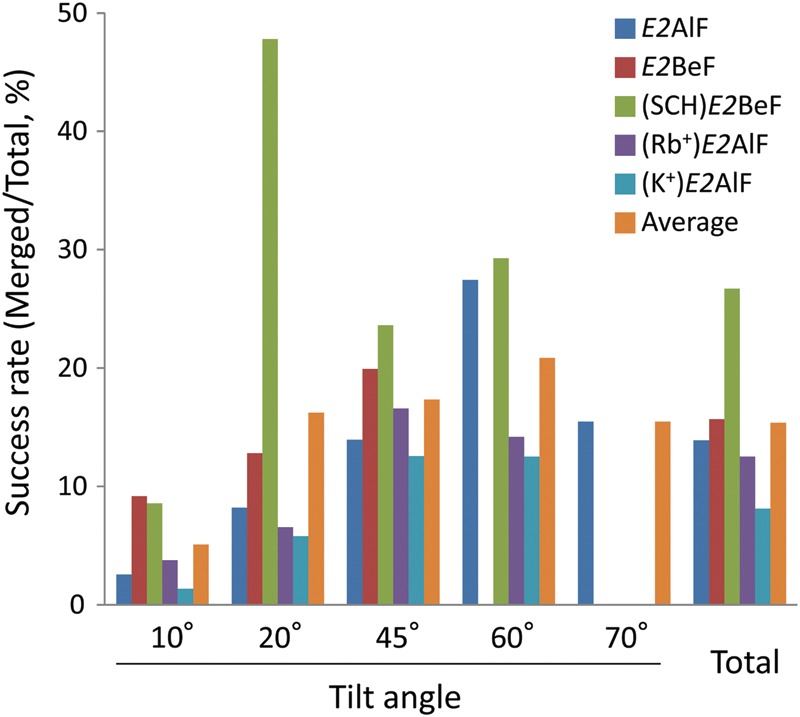
Fig. 5.

Statistics of data collection from carbon-sandwiched specimens. Success rate was calculated from the number of micrographs merged into the 3D structure factor per total number of micrographs obtained, for each crystal sample in a different conformation of the transport cycle as indicated by different colors in the figure. For interpretation of colour in this figure, the reader is referred to the web version of this article.
