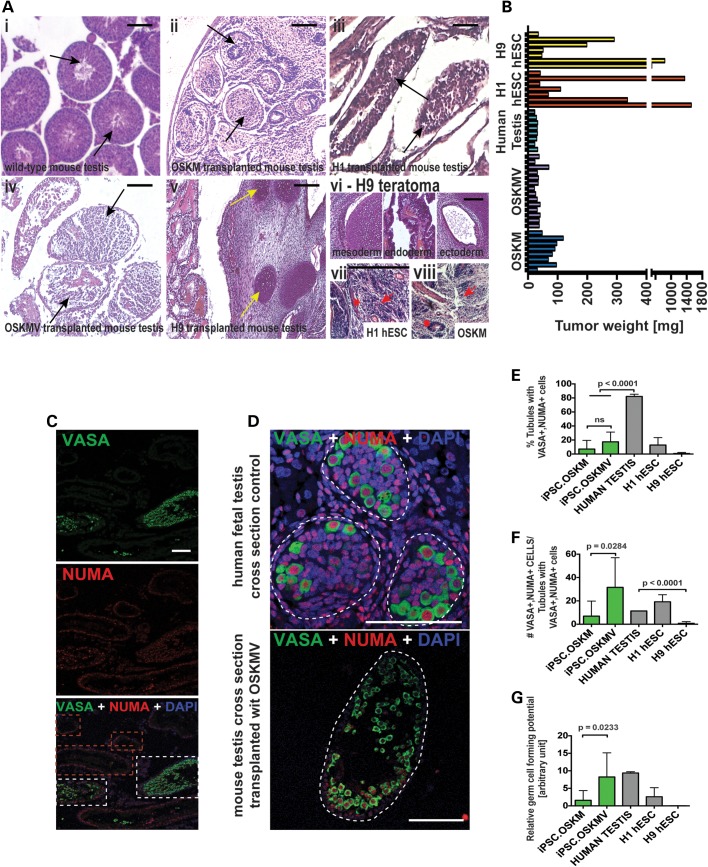
Figure 4.
Transplantation of OSKM and OSKMV followed by quantification analysis. (A) Hematoxylin and eosin staining of histology cross sections of tubules inside mouse testes. (i–v) Black arrows indicate individual tubules. Yellow arrows indicate cartilage formation in H9 transplanted cells as example for teratoma formation. Scale bar, 100 µm. (vi) H9 transplanted cells formed teratomas indicated by three germ layers. (vii and viii) H1 and OSKM cells formed fibrotic structures that resembled embryonal carcinoma (EC) cells and yolk sac tumors. (B) Weight of testis 2 months after transplantation of cells (OSKM and OSKMV cells with three controls: human testis, H1 hESC and H9 hESC line). (C) Representative low-magnification image of histology cross section of multiple tubules stained with NUMA and VASA indicating that only a fraction of tubules formed VASA-positive cells. Red dashed rectangle indicates tubules with NUMA only cells along the basement membrane. White rectangle indicates NUMA/VASA-positive tubules. Scale bar, 50 µm. (D) Representative image of histology cross section of one single tubule. Single NUMA/VASA-positive cells were counted for quantification. Scale bar, 50 µm. (E–G) Quantification of immunohistochemistry results of cross sections from OSKM and OSKMV cells compared with both controls. All serial sections were subject to counting (see Materials and Methods) Scale bar, 80 µm. (E) Percentage of tubules with positive VASA/NUMA co-staining calculated (against total number of counted tubules). iPSC.OSKMV is also significantly different from H9 control (P = 0.0432) (F) For each positive tubule, VASA-positive cells that co-stained with NUMA were counted and calculated against positively stained tubules. iPSC.OSKMV is also significantly different from H9 control (P = 0.0397) (G) Relative germ cell forming potential calculated by multiplying fraction of positively stained tubules with number of VASA/NUMA co-stained cells for each sample. iPSC.OSKMV is also significantly different from H9 control (P = 0.0417).

