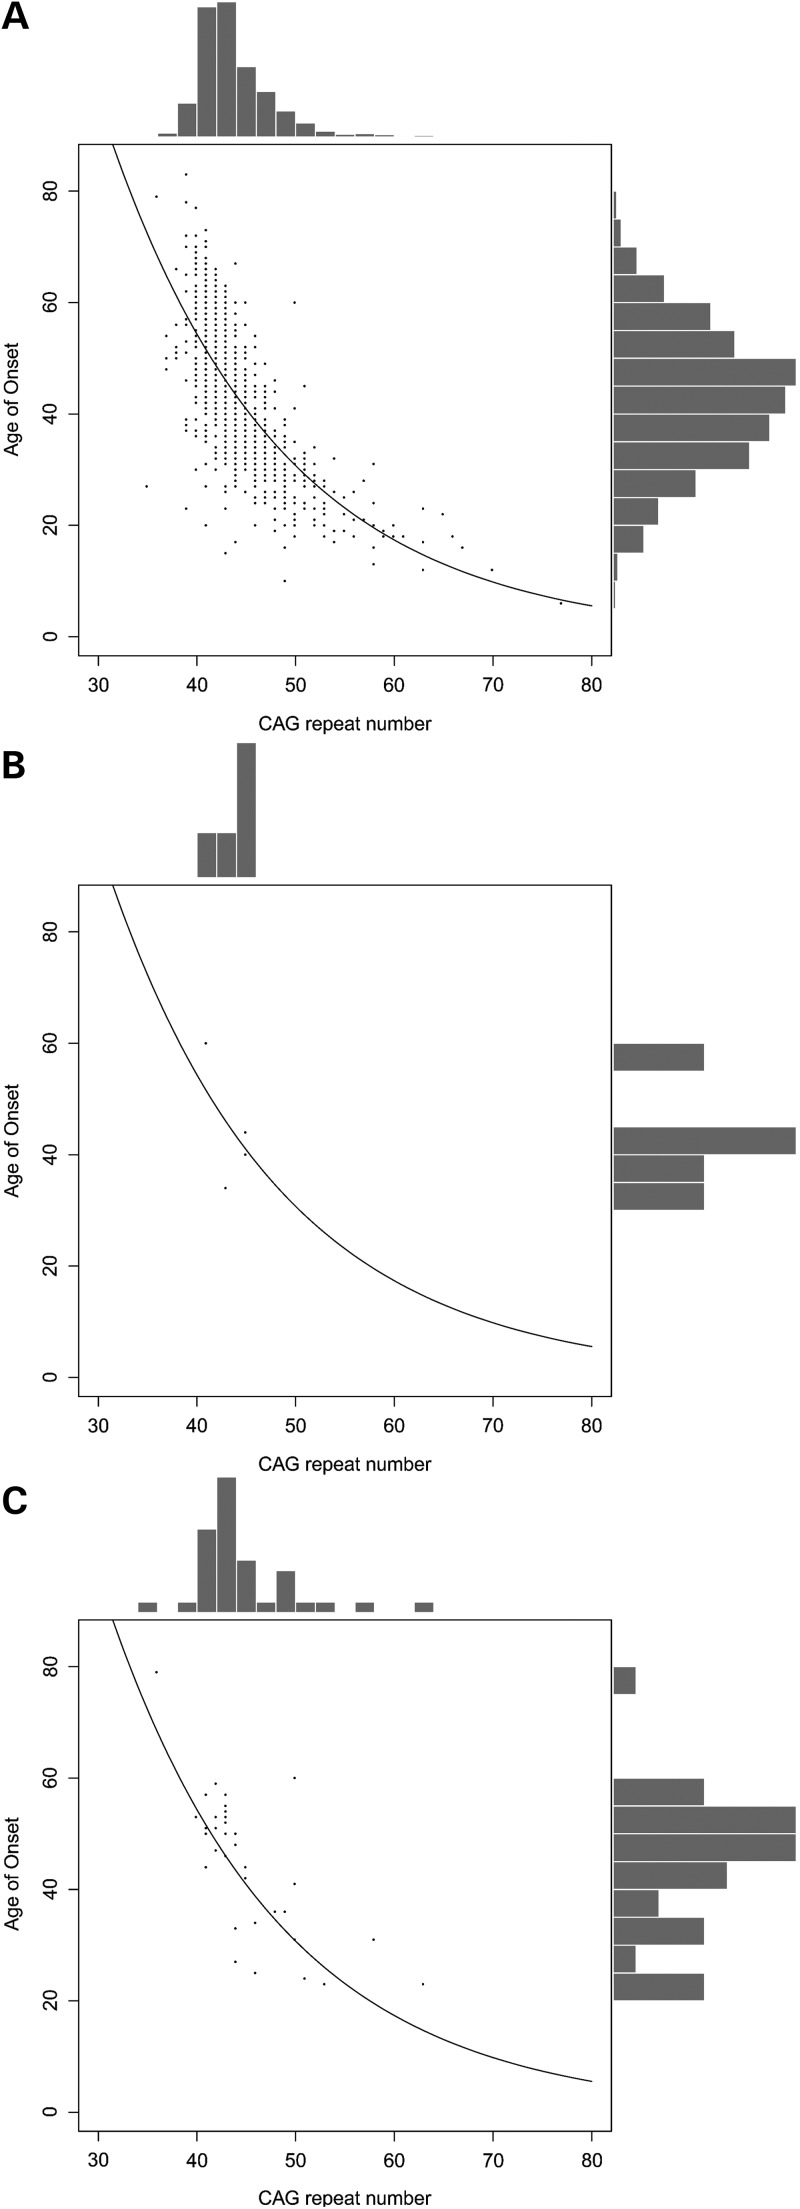
Figure 2.
CAG length and AO of HD cohort, stratified by SLC2A3 copy number. Scatterplots and histograms are shown for patients stratified by SLC2A3 copy number. The exponential best fit line is shown, reflecting the linear best fit on log-transformed AO data. (A) Patients with SLC2A3 copy number of two. (B) Patients with SLC2A3 copy number of one. (C) Patients with SLC2A3 copy number of three.

