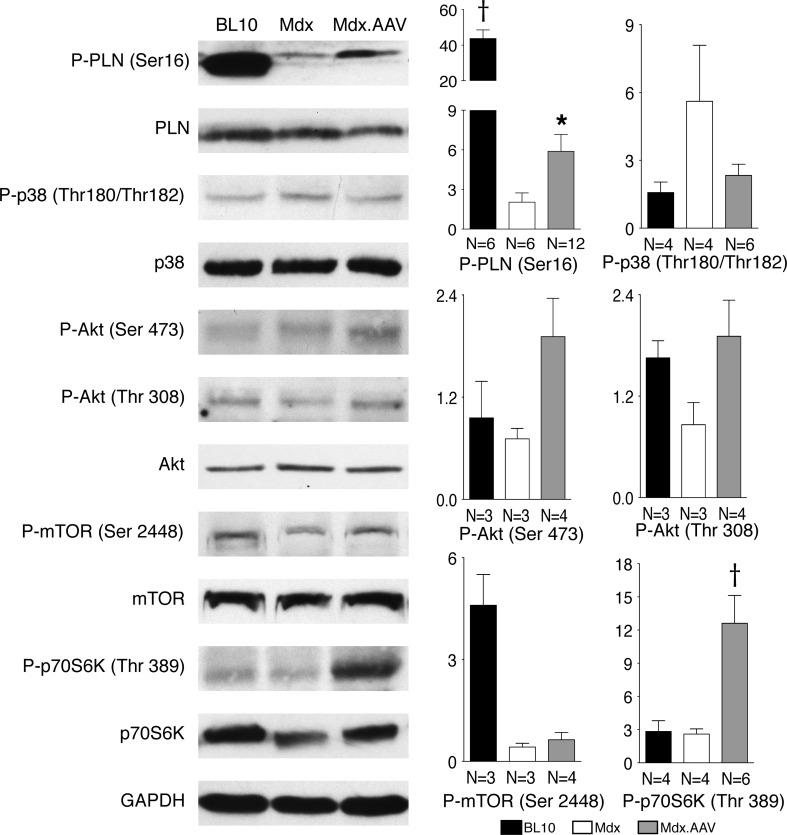
Figure 5.
Immunoblot examination of phospholamban (PLN), p38 and the Akt/mTOR/p70S6K pathway. Left panels: representative immunoblot for each indicated protein and their phosphorylated form. Right panels: densitometry quantification results. The sample size is marked in bar graphs for each group. Asterisk: treated mdx is significantly different from that of untreated mdx; cross: significantly different from other two groups.

