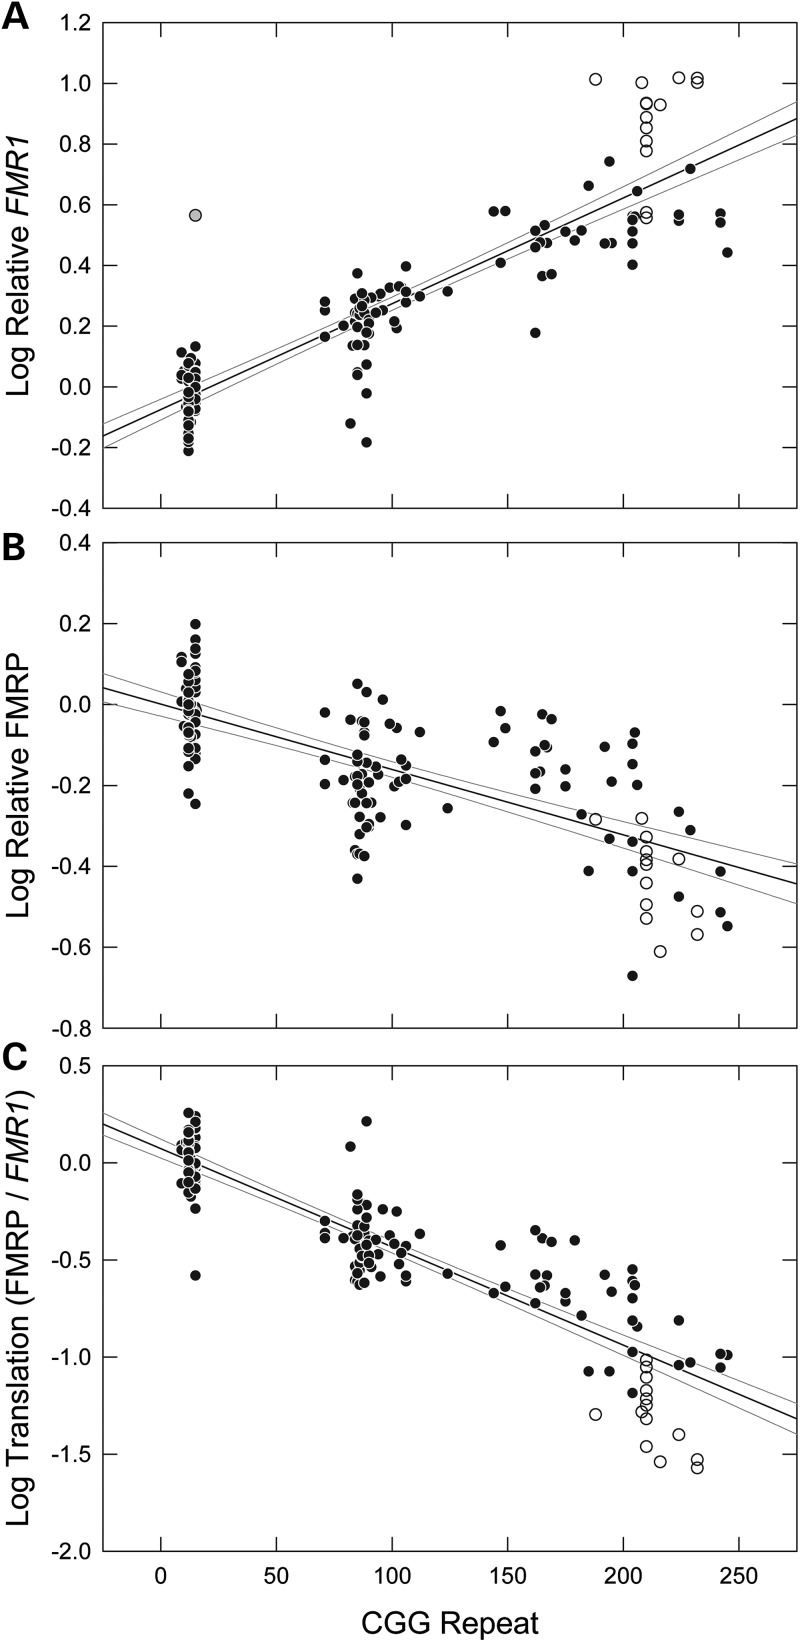
Figure 1.
Scatter plots of mouse CGG repeat versus: (A) Fmr1 mRNA level (normalized to the endogenous control Gusb), (B) FMRP protein level (normalized to Gapdh) and (C) the ratio of FMRP to Fmr1 mRNA, an indication of Fmr1 translation efficiency. Each graph includes solid black regression lines and gray 95% confidence interval lines. Open circles indicate animals that were bred as F2 crosses of animals from the initial breading. One outlier is shaded gray. FMR1 mRNA measurements were performed in triplicate, and FMRP measurements were in duplicate. R-squared values are as follows: Fmr1 = 0.80, FMRP = 0.52 and Fmr1/FMRP = 0.80.

