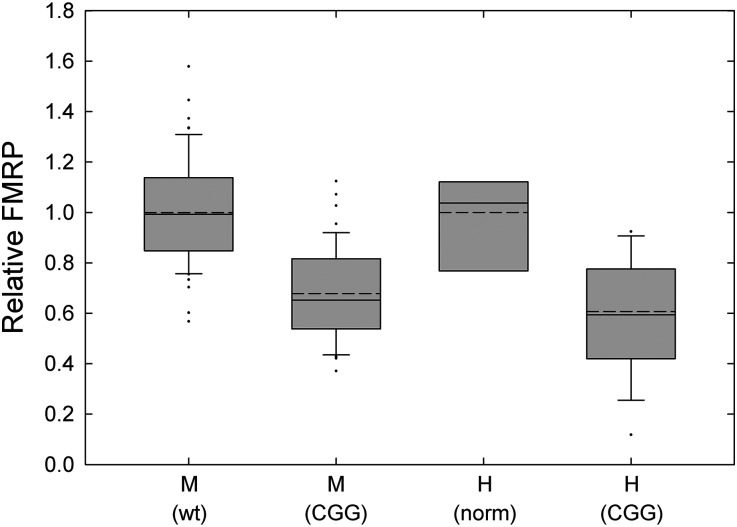
Figure 2.
Box-plot comparison of human and mouse brain FMRP levels. FMRP levels in the frontal cortex of normal (n = 7) and premutation (n = 17) human individuals and wt (n = 57) and expanded-CGG (n = 48) mice. Solid bisecting lines are medians, dotted lines are means and individual points represent outliers. Error bars are standard errors of the mean (SEM). Significant differences were seen between the following groups: P < 0.001 for mouse wt versus mouse expanded; mouse wt versus human expanded; human normal versus human expanded; and human normal versus mouse expanded, using one-way ANOVA. The P-value between mouse expanded and human expanded is 0.26.

