Figure 2.
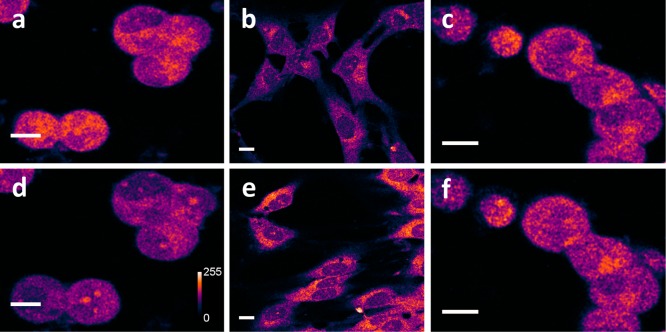
Two-photon autofluorescence of dopamine in MN9D cells and glia. (a, d) Collection of dopaminergic MN9D cells before (a) and 15 min after (d) treatment with 100 μM of PCA. The signal intensity decreases by 34 ± 5%. Vehicle-treated control cells are shown under identical imaging conditions in (c) (before) and (f) (after). The control cells show 1 ± 3% increase in the same period. (b, e) Glia treated with vehicle (b) and 10 mM dopamine for 4 h (e). Fluorescence intensities are false color coded. For (b) and (e), the brightness is 3× enhanced. Scale bar = 10 μm.

