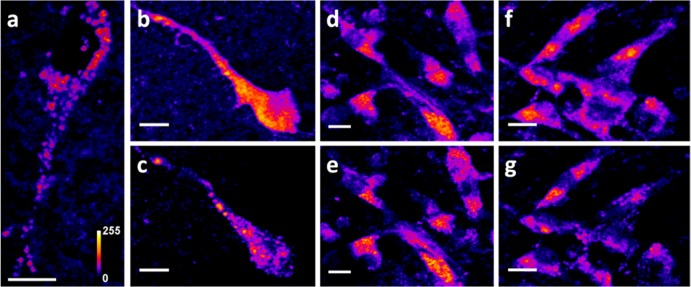
Figure 3.

Imaging dopamine and its dynamics in live brain tissue. (a) Substantia Nigra neuron. The bright punctate dopaminergic vesicles/clusters are seen distributed in the cytoplasm and also in the primary neurite. (b, c) Dopaminergic cell before (b) and 15 min after (c) bath application of 50 mM KCl and 8 mM Ca2+. The fluorescence intensity decreases by 25 ± 4%. (d, e) Vehicle treated cells, before (d) and 15 min after (e), show negligible (3 ± 1%) decrease under identical imaging conditions. (f, g) Dopaminergic cells before (f) and 15 min after (g) treatment with 100 μM of PCA. The fluorescence intensity decreases by about 24 ± 2%. Fluorescence intensities are false color coded. Scale bar = 10 μm.
