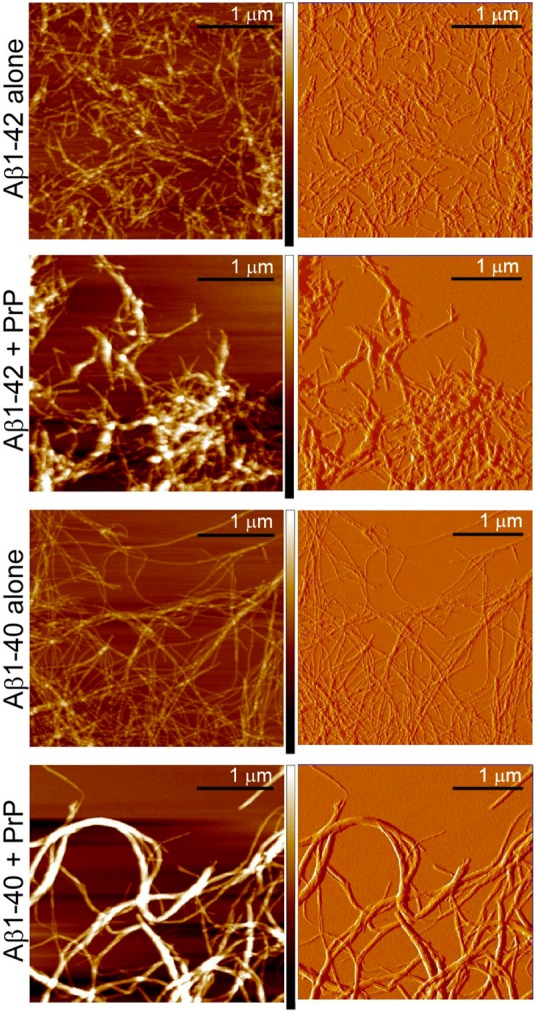
Figure 5.

Lateral association of mature Aβ fibrils by PrP as evidenced by AFM. The images show Aβ1–42 or Aβ1–40 fibrils alone and upon addition of PrP. The concentration of both Aβ and PrP was 14 μM. Left and right panels show AFM images in height and amplitude modes, respectively. The color coded bars at left panels illustrate the height scale in the range between 0 nm (darkest color) and 50 nm (white color).
