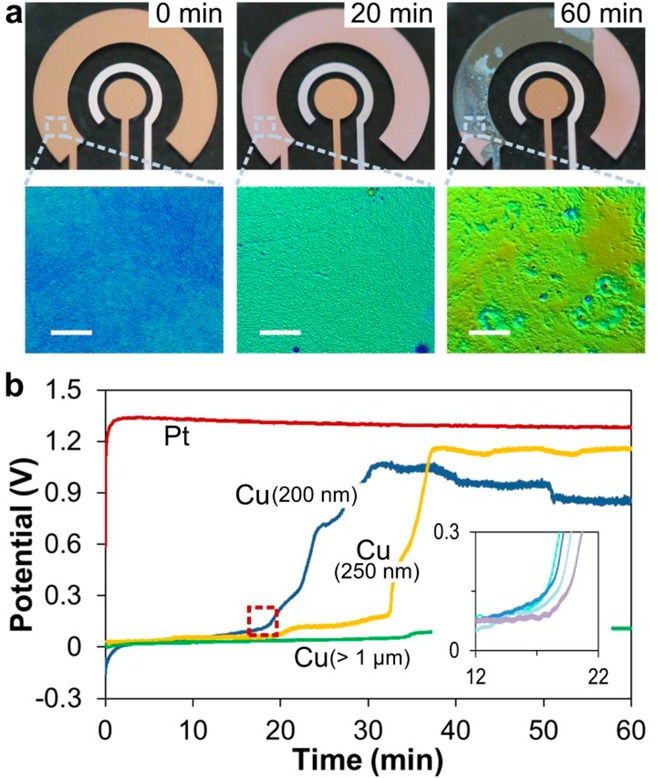
Figure 2.

Stability of Cu as an auxiliary electrode. (a) Images of a clean Cu AE and Cu AEs that have undergone 20 and 60 min of oxidation with zoom-in optical profiler images illustrating surface roughness (scale bar represents 100 μm). (b) Chronopotentiometry of Pt and Cu AEs under the current of 10 μA. The Cu AEs varied in thickness from 200 nm to >1 μm. The curve for 200 nm Cu AE is an average of n = 4 measurements. Close-up of the point of failure indicated with dashed line is shown in the inset, which illustrates the actual four curves used in obtaining the average.
