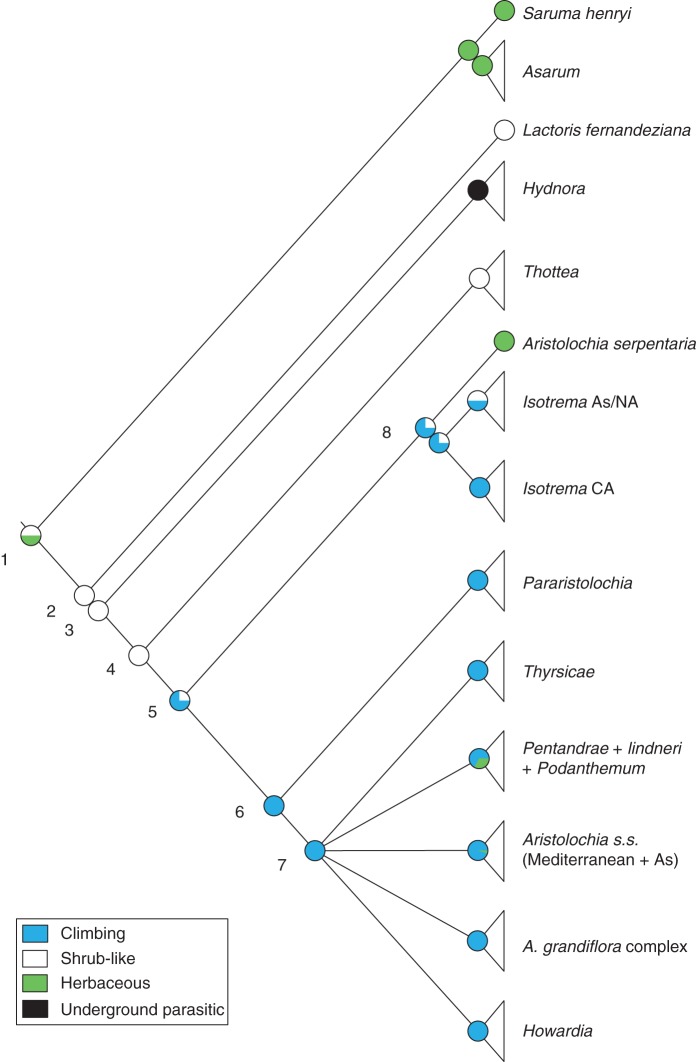
Fig. 8.
Ancestral character state reconstruction of the perianth-bearing Piperales. Reconstruction based on expected species number per clade (see Table 1); triangles represent the respective number of species in each clade; character state frequencies for the 500 randomly modified trees are depicted in pie chart diagrams at each node. Nodes are numbered for easier reference to the text. CA, Central America; NA, North America; As, Asia.

