Fig. 5.
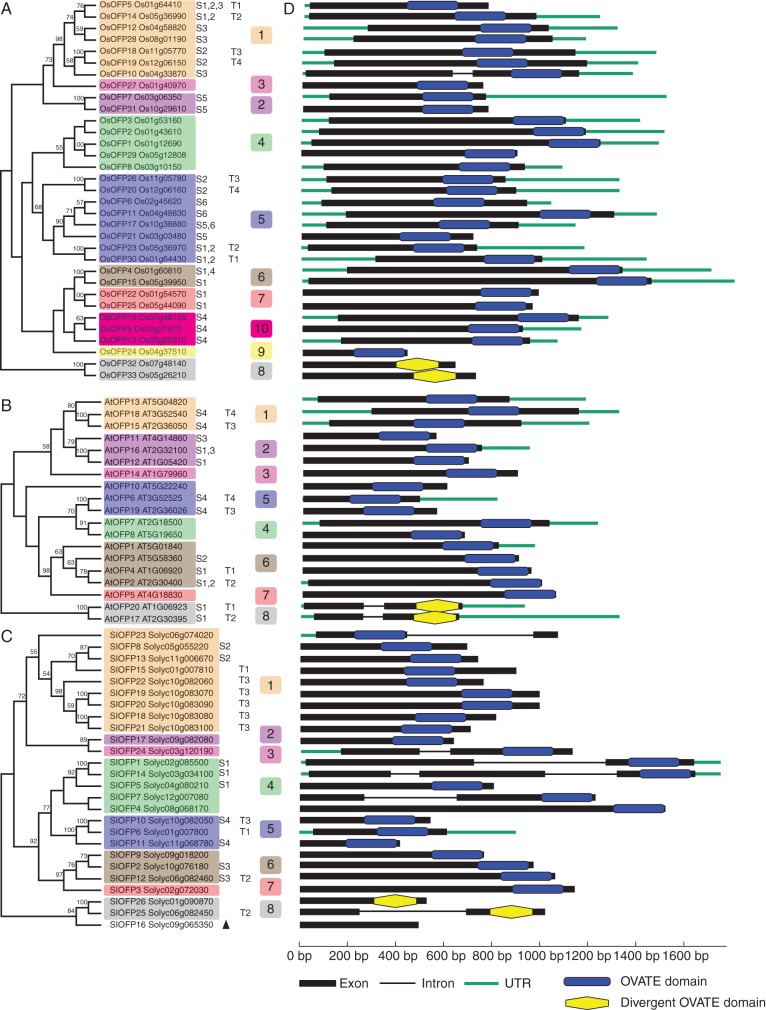
Phylogenetic analyses of OsOFPs in rice (A), AtOFPs in arabidopsis (B) and SlOFPs in tomato (C). The genomic organization of the corresponding OVATE protein-coding genes is shown in (D). Colours represent the sub-groups to which the OVATE proteins belong in the analysis of the 13 plant genomes. ‘S1’ to ‘S6’ indicate segmentally duplicated genes in segmental duplication blocks corresponding to Fig. 4; ‘T1’ to ‘T4’ indicate tandemly duplicated gene arrays in the chromosomes. Bootstrap values > 50 % are indicated above the branch. The black triangle in (C) marks SlOFP16, which was excluded from the phylogenetic analysis of all OVATE proteins from the 13 plant genomes. Blue rectangles mark the conserved OVATE domains, while yellow hexagons mark the divergent OVATE domains.

