Fig. 6.
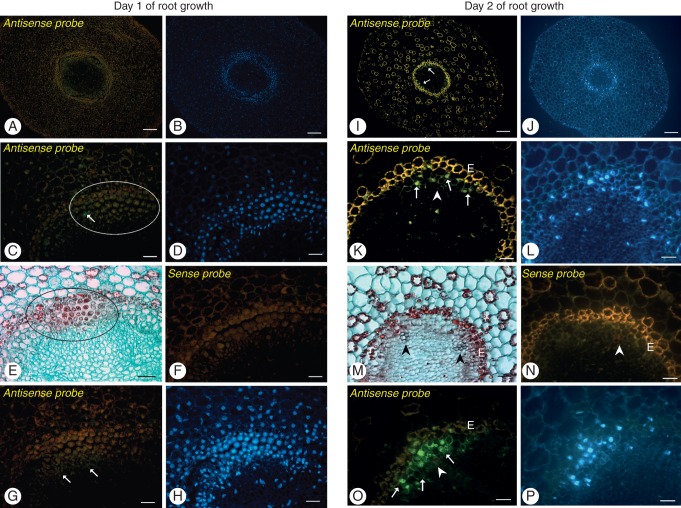
Fluorescent in situ hybridization with PoptrCAD4 (A–F, I–N) and PoptrCAD10 (G, H, O, P) probes on the first vs. the second day of root growth. Hybridization signal is visible as green fluorescence (Alexa 488, arrows). To visualize the lack (E) or the degree of xylem differentiation (M), the same root segments as analysed for FISH were observed using light microscopy on sections stained with Safranin and Fast Green. In addition, DAPI staining was used to visualize nuclei (B, D, H, J, L, P). First non-functional xylem vessels are indicated by arrowheads; slight lignin autofluorescence is visible in red. Note the lack of hybridization signal in the undifferentiating cells (encircled) on the first day of root growth and in the protoxylem vessels, and the positive hybridization signal in the first primordial TEs and in the thin-walled cells adjacent to the xylem pole (arrows). Control experiments using sense probes did not result in significant signals in any structure (F, N). E, endodermis. Scale bars (A, B, I, J) = 100 μm; (C–H, K–P) = 50 μm.

