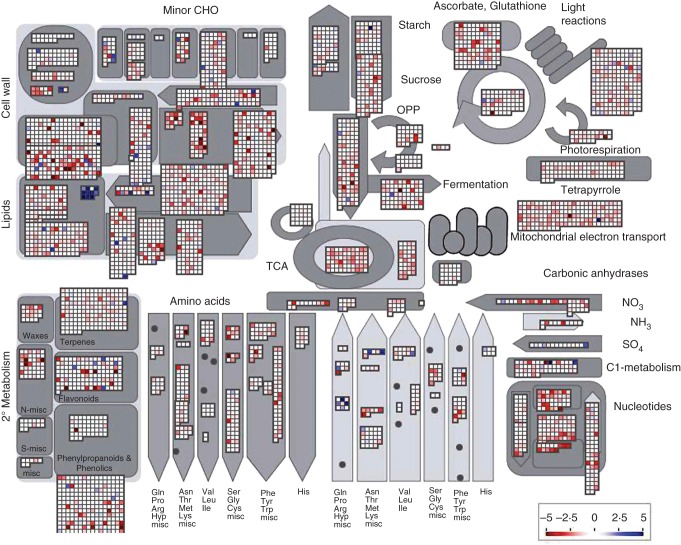
Fig. 4.
Overview of soybean seed metabolism throughout seed development. A visualization of soybean metabolism gene transcript abundance changes is shown using MapMan. This map shows a comparison of –1 seed with +4 seed gene expression in general metabolic pathways. The greatest gene transcript abundance increases (blue) are seen in lipid, primary amino acid metabolism and C1-metabolism genes. The largest decreases in transcript abundance (red) are found in cell wall, nucleotide, fermentation, ascorbate and secondary metabolism genes.

