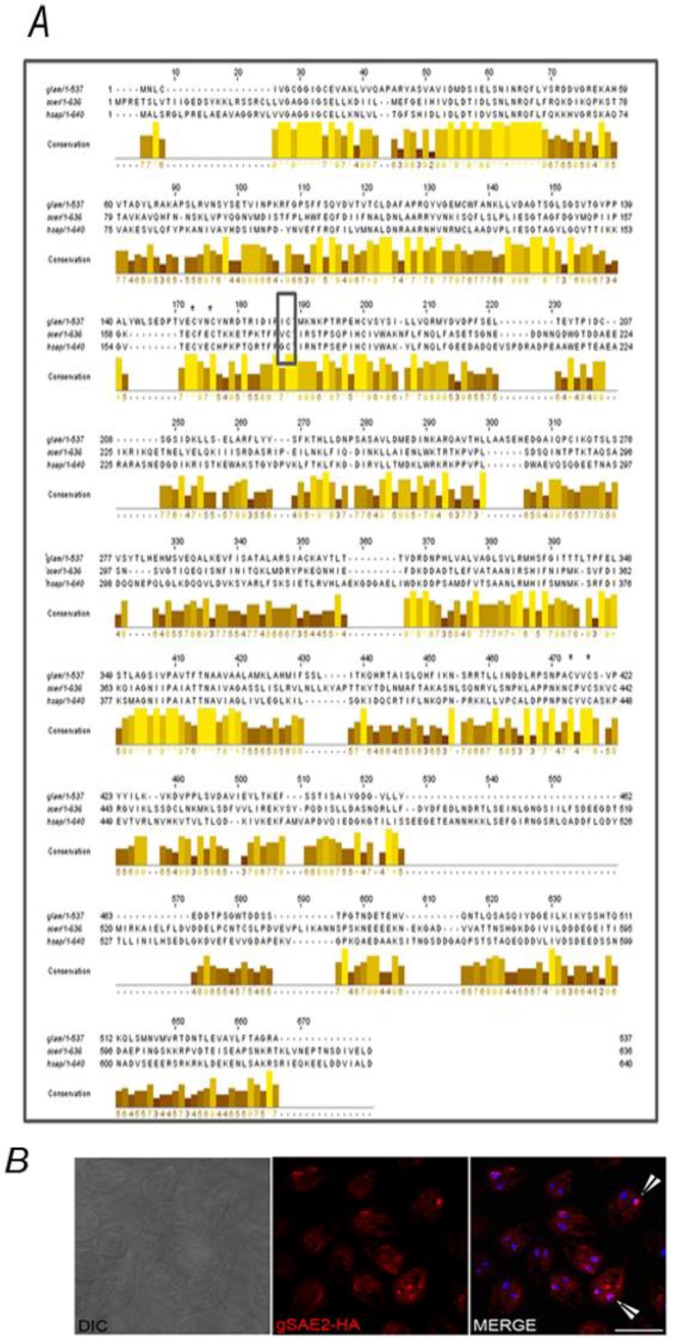
Figure 6.
In silico analysis and localization of the putative gSAE2. (A) Jalview image shows amino acid sequence alignment of the SAE2 from G.mlamblia (glam), S. cerevisiae (scer), and H. sapiens (hsap). Bar graphs showing the amino acid conservation at each residue are shown. The putative active-site cysteine residue (C178 in Giardia) is indicated by empty black box while the cysteines corresponding to putative Zn+ motive are denoted by asterisks. (B) IFA using anti-HA mAb (red) and confocal microscopy show the cytoplasmic and nuclear (DAPI) localization of gSAE2-HA (arrow). Scale bar: 10 µm.

