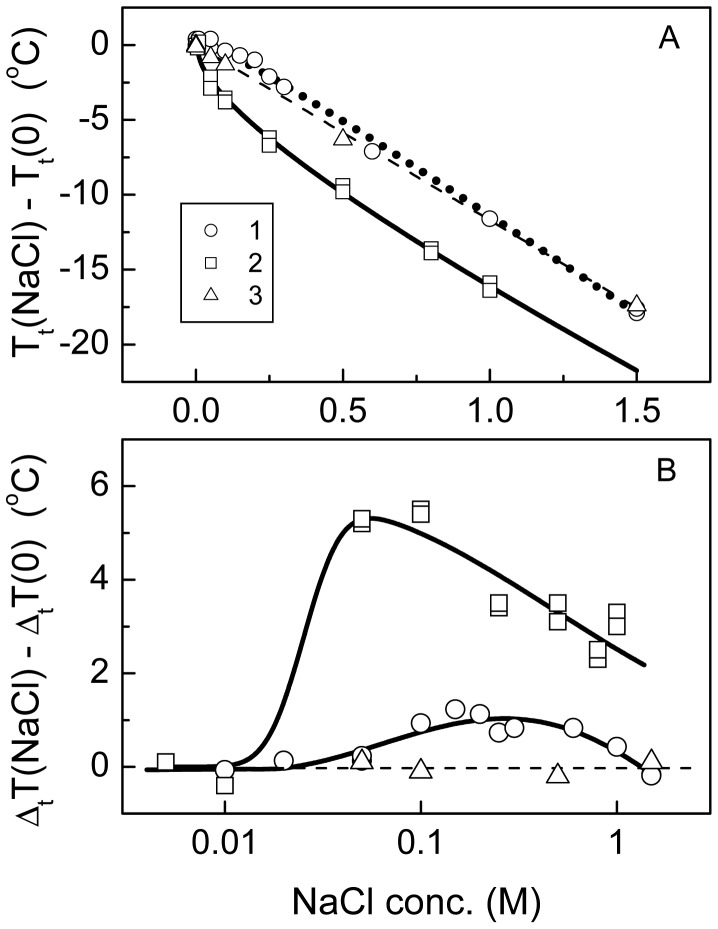
Figure 4.
Changes in the transition temperature (A) and width (B) vs. NaCl concentration for the polyampholyte NIPA-APMA-AAc (1), NIPA-AAc (2) and NIPA (3) hydrogels: A—solid and dotted lines correspond to equation (1); dashed line corresponds to equation (2).

