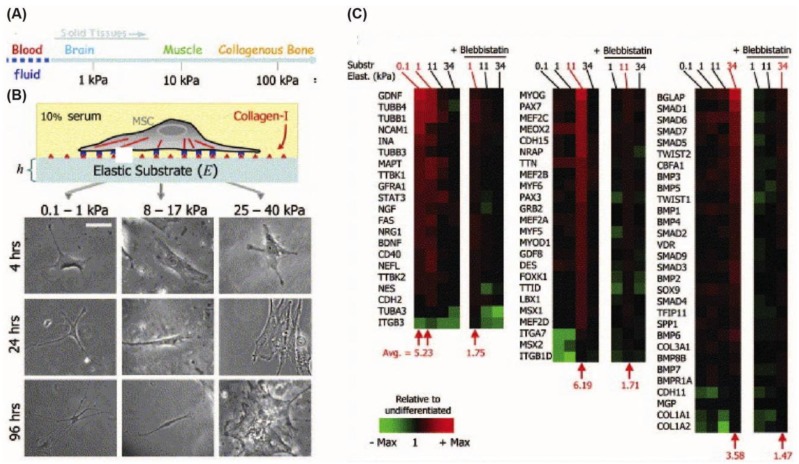
Figure 4.
(A) The elastic moduli of different solid tissues ranging from blood to collagenous bone; (B) The images show how different substrate stiffness values influence cell morphology. Scale bar is 20 μm; (C) Microarray profiling of differentiation marker expression on substrates with different stiffnesses. The microarray profiling showed that neurogenic markers were highest on 0.1–1 kPa gels, while myogenic markers were highest on 11 kPa gels and osteogenic markers were highest on 34 kPa gels. (Published with permission from Elsevier [7]).

