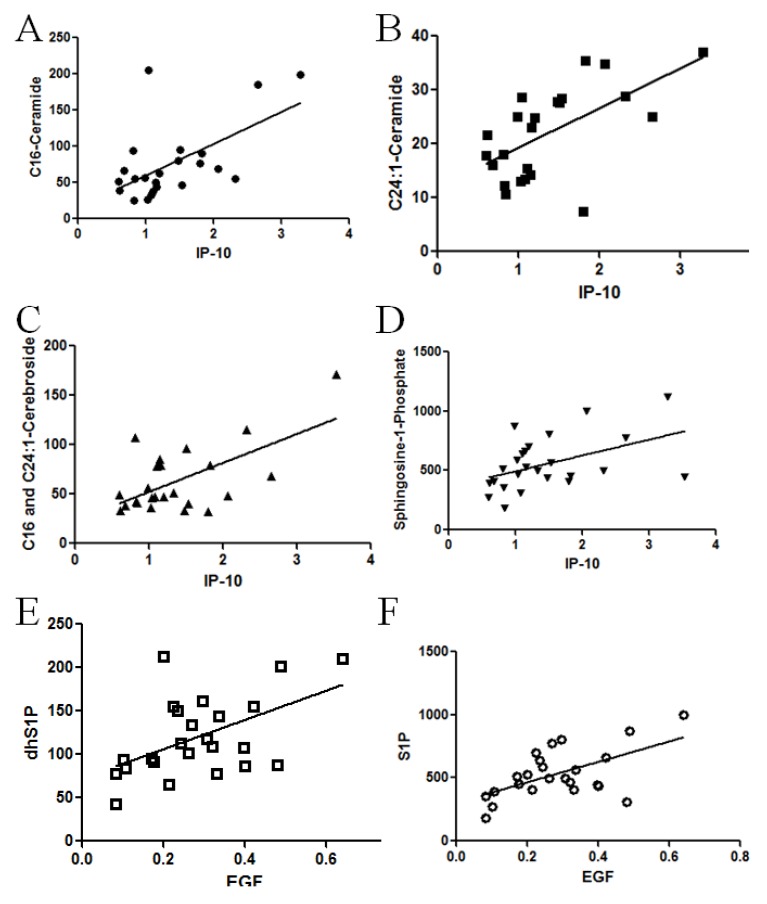
Figure 5.
Correlation between cytokines and sphingolipid alterations in patient specimens with pancreatic cancer. To determine if a statistical relationship exists between cytokines and sphingolipids in patient specimens, Pearson correlation analysis was performed. (A) Tissue C16-ceramide and plasma IP-10 levels (r = 0.583, p = 0.0035); and (B) tissue C24:1-ceramide and plasma IP-10 levels from tissue demonstrate a positive correlation (r = 0.6012, p = 0.0024); (C) as did plasma C16:0 and C24:1 cerebroside mass (r = 0.6174, p = 0.0013), with plasma IP10; and (D) plasma S1P with IP10 (r = 0.4655, p = 0.019). Plasma EGF levels demonstrated positive correlated with both plasma; (E) S1P (r = 0.6928, p = 0.0001) and (F) dhS1P (r = 0.6787, p = 0.0002) levels.

