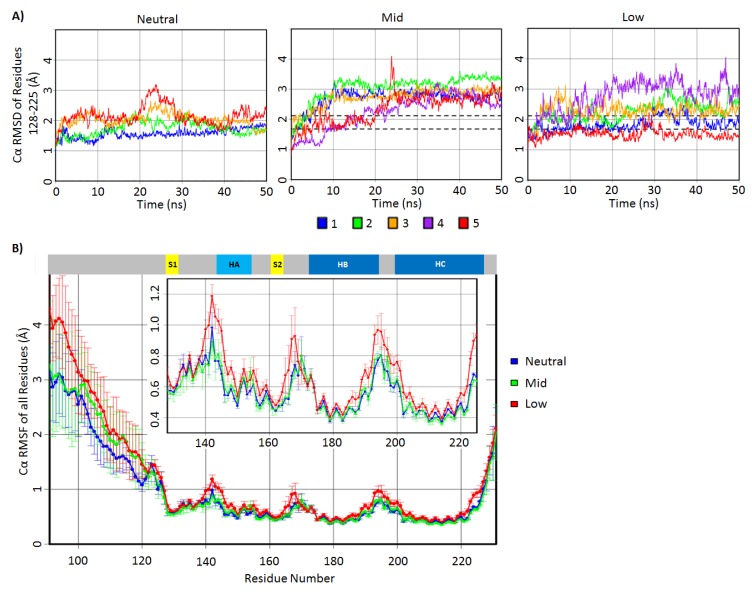
Figure 2.
Cα root-mean-square deviation (RMSD) and root mean square fluctuations (RMSF) of the bovine PrP simulations. (A) Residue 128–225 Cα RMSD of the neutral, mid- and low pH simulations plotted over time. The area in between the dotted lines is within one standard deviation of the 25–50 ns averaged Cα RMSD of the neutral pH simulations. (B) Averaged Cα RMSF plotted for all residues in neutral, mid- and low pH simulations. The inset plot shows Cα RMSF for residues 128–225 in a magnified scale. Native secondary structures of the PrP are shown at the top of the Cα RMSF plots.

