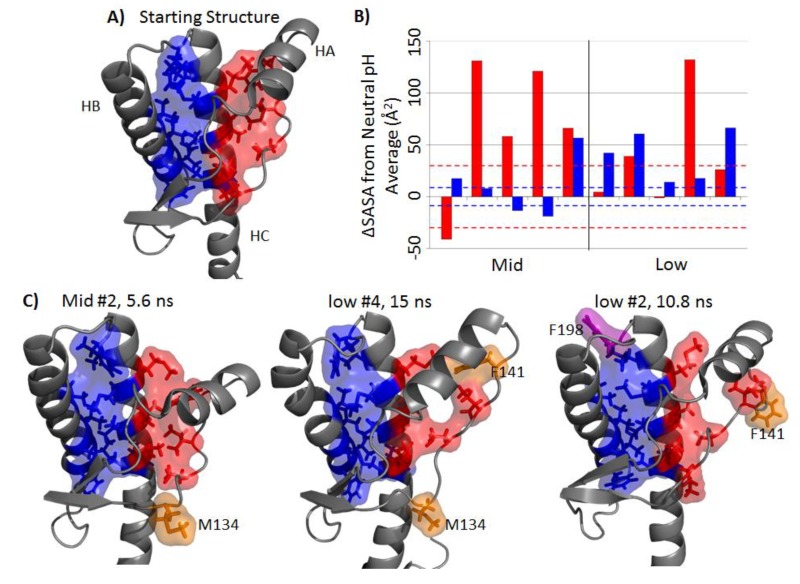
Figure 5.
Disruption of the hydrophobic core. (A) Two regions of the hydrophobic core: HA-HC (red) includes residues 134, 137, 139, 141, 205, 209 and 213; HB-HC (blue) includes residues 175, 176, 179, 180, 184, 198, 203, 206, 210, 214 and 215. (B) Side chain solvent accessible surface area (SASA) deviation from the averaged neutral pH simulation for the last 25 ns, where red and blue bars corresponds to the HA-HC and HB-HC hydrophobic core region, respectively. The area within a pair of dotted lines indicates values within one standard deviation of the averaged SASA of the neutral pH simulations. (C) Typical structures where significant SASA increased for mid- and low pH simulations. Magenta and orange residues are residues that become significantly exposed in the HB-HC region and the HA-HC region, respectively.

