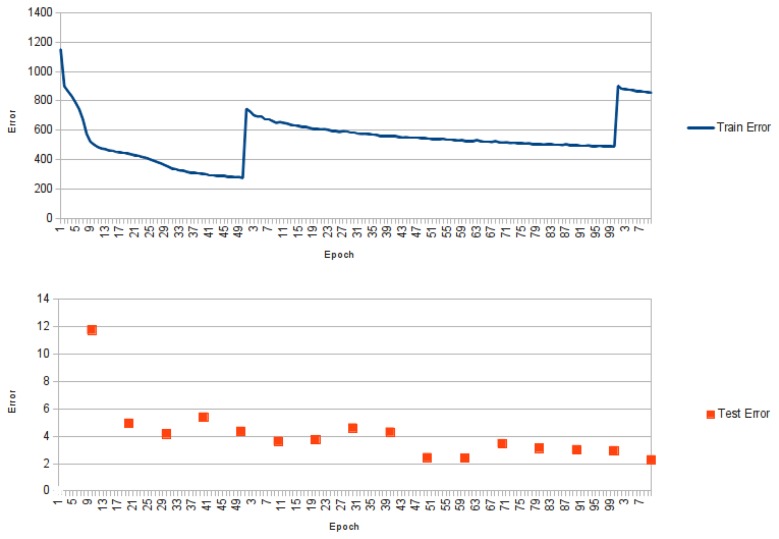
Figure 2.
Graphic showing the training error for NNPIF over three training phases. At the end of the first training phase, new examples are generated by the reconstructor and added to the training set. This results in a spike of the error for the first epoch of the second phase. The same happens between the second and third training phase. The lower graphic shows the error for the same training over the test set, which is evaluated once every 10 epochs.

