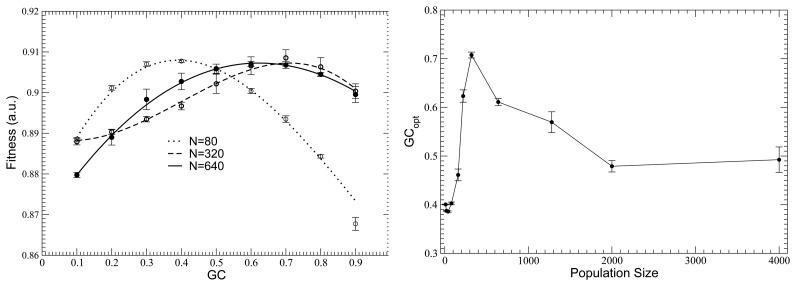
Figure 6.
(Left) For fixed population size, fitness, and, hence, protein stability, attains a maximum as a function of mutation bias, measured as the GC content that would be attained under mutation alone. The three curves have been vertically shifted to make the intra-curve comparison clearer. (Right) This optimal mutation bias, GCopt, depends on the population size; it favors AT for a small population size, GC for intermediate population size and the absence of bias (GC = 0.5) for a very large population size. Reproduced from [79], copyright of the authors.

