
Figure 6.
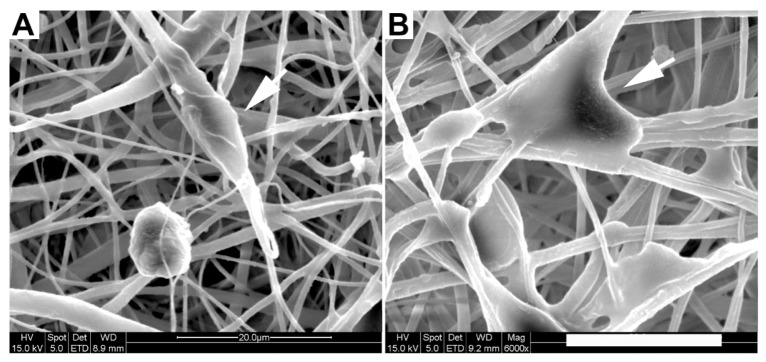
SEM images of rat cortical cells on (a) PEGPCL G-PCL EFM; (b) PEGPCL G-PCL/PEGPCL EFM composite materials. Arrows indicate representative cells. Scale bar: 20 µm.
Official websites use .gov
A
.gov website belongs to an official
government organization in the United States.
Secure .gov websites use HTTPS
A lock (
) or https:// means you've safely
connected to the .gov website. Share sensitive
information only on official, secure websites.
SEM images of rat cortical cells on (a) PEGPCL G-PCL EFM; (b) PEGPCL G-PCL/PEGPCL EFM composite materials. Arrows indicate representative cells. Scale bar: 20 µm.