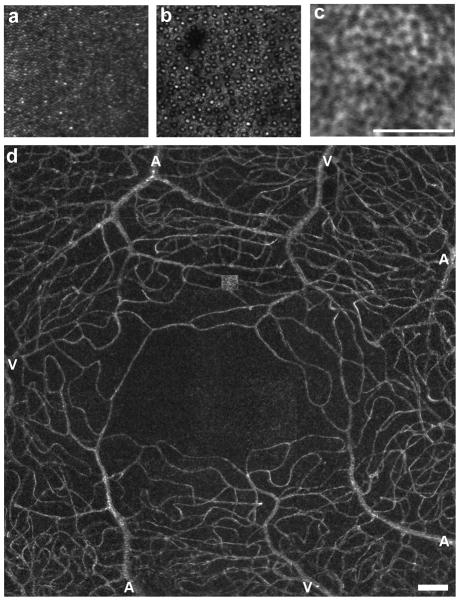
Figure 1.
Reflectance images of the photoreceptor mosaic (a, b). Panel a is an image of the parafoveal cone mosaic, with the foveal center at the lower right corner of the image; image courtesy of Jacque Duncan, MD, University of California San Francisco. Panel b is an image of the perifoveal rod and cone mosaic, with the rods being the smaller structures amongst the coarser cone mosaic.48 Panel c is an autofluorescence image of the RPE mosaic taken at approximately 10 deg superior from a 26 year old male (550 nm excitation wavelength). Panel d is a standard error map showing the complete foveal microvascular network in a 35 year old male. Image courtesy of Stephen Burns and Toco Chui, Indiana University.96 Arterioles and venules are labeled as “A” and “V”, respectively. Scale bars are 100 μm.

