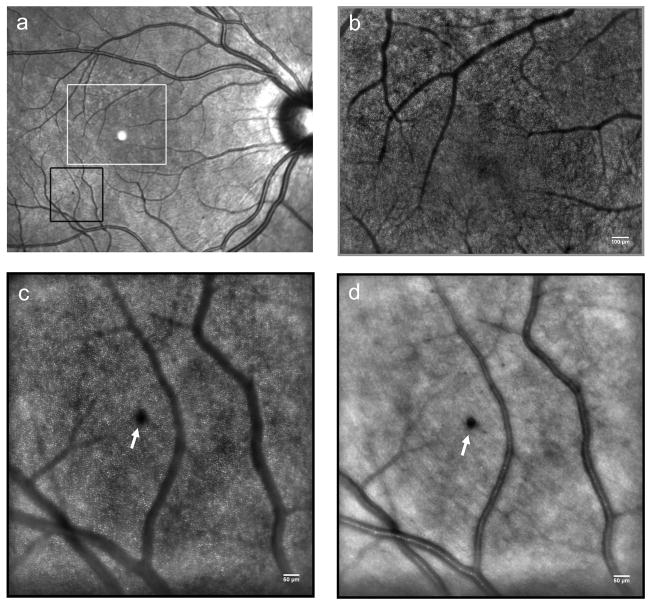
Figure 6.
Panel (a) shows a wide field fundus image from the left eye of a patient with NPDR. The white box indicates the area of the retina shown in panel (b) and the black box indicates the area of the retina displayed in panels (c) and (d). (b) Adaptive optics retinal imaging allows for a more detailed visualization of the capillary network around the FAZ. Scale bar is 100 μm. High-resolution images of the photoreceptor layer (c) and the overlying structures of the inner retina (d) can be acquired at exactly the same location with AO ophthalmoscopy. A micro-haemorrhage (white arrow) can be clearly focused on the retinal nerve fiber layer. The cone photoreceptors underlying the haemorrhage cannot be resolved (masking effect). (c) and (d) Scale bars represent 50 μm.

