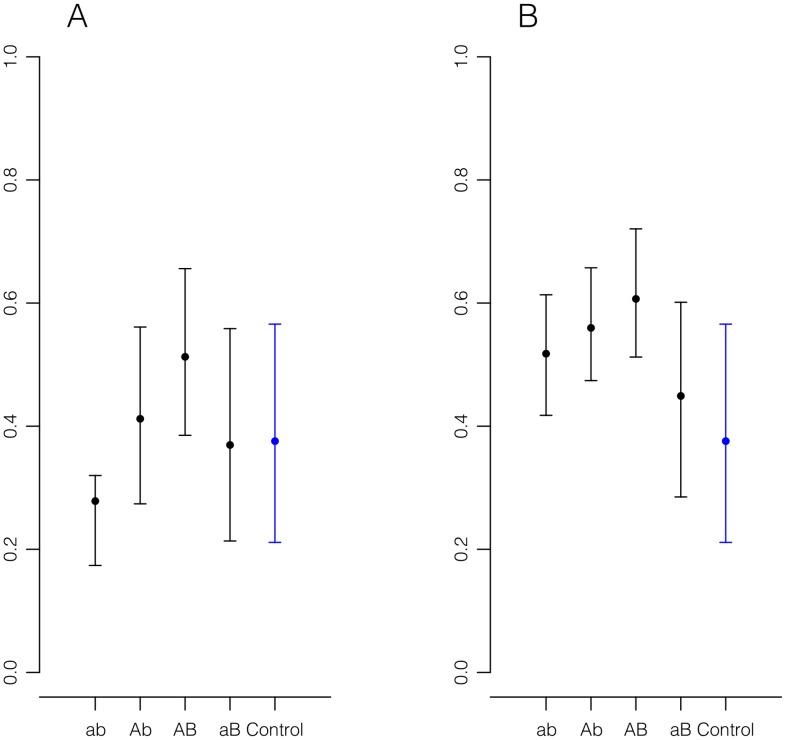
Figure 3. 1000 adaptive walks simulated on NK landscapes with N = 15 and K = 10.
For each walk, the starting genotype  was randomly drawn to have relatively low fitness (see Text S1 for details). A. Intervals covering fitnesses between the 2.5 and the 97.5 percentiles are shown for the first (ab), second (
 ), and third (
 ) genotypes in randomly generated adaptive walks, with dots indicating the medians. The genotype
  is the remaining genotype in the quadruple as shown in Figure 1. The blue “Control” interval corresponds to randomly selected genotypes. The skew visible in the ab interval is due to the fact that the initial genotype of a fitness walk is drawn from a lower tail distribution. B. Intervals for the fourth, fifth, and sixth genotypes in randomly generated adaptive walks. The increased fitness of the aB genotypes in B relative to that of A is due to the fact that
  , and thus there is some correlation between neighboring genotypes. In both diagrams, the dependency of sign epistasis on regression to the mean is apparent.

