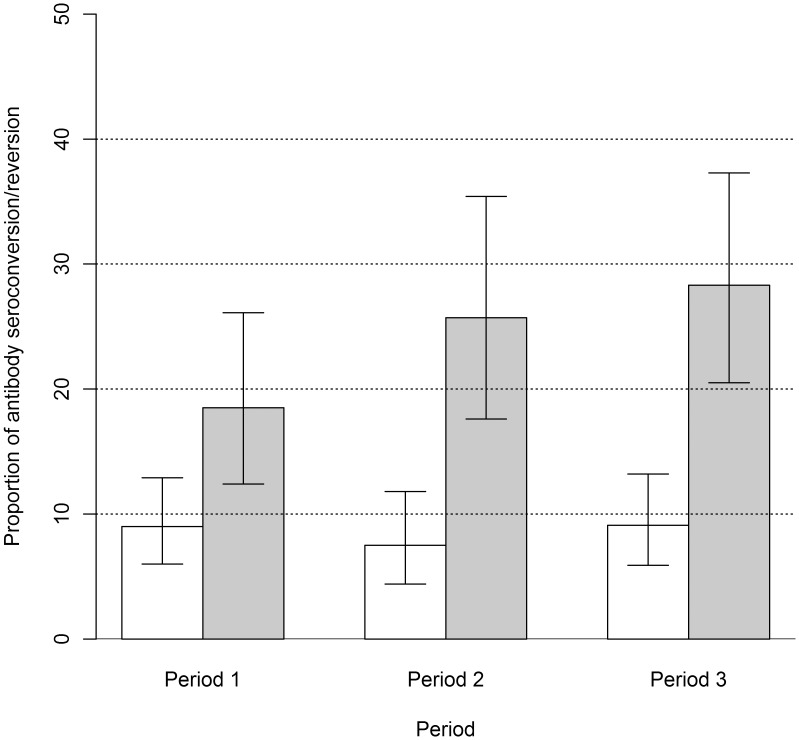
Figure 2. Proportions of Ab seroconversion and seroreversion by time period.
White bars represent proportions of Ab seroconversion whereas grey bars represent proportions of Ab seroreversion; vertical error bars represent the upper and lower limits for the 95% binomial exact confidence interval; Period 1 stands for the period between Sampling round 1 and sampling round 2 (June–November 2009); Period 2 stands for the period between sampling round 2 and sampling round 3 (November 2009–July 2010) and Period 3 stands for the period between sampling round 1 and sampling round 3 (June 2009–July 2010).

