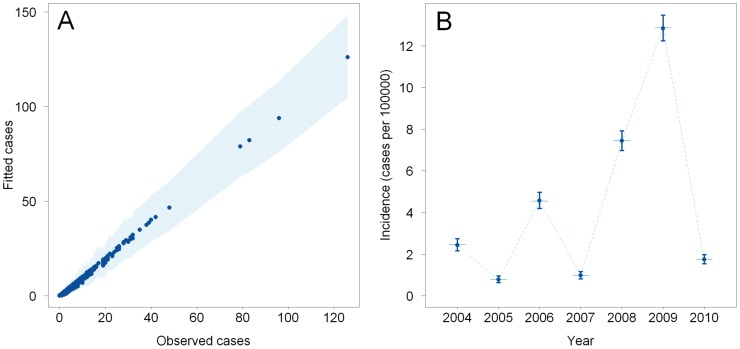
Figure 3. Multivariate model goodness of fit.
(A) Scatter plot of the fitted posterior mean numbers of meningococcal meningitis A cases per year and health centre catchment area and their 95% credible intervals (CIs) (light-blue shaded region) versus the observed numbers. (B) Observed incidence rates (horizontal blue lines) per year over the study region and their corresponding fitted posterior mean annual incidence rates (filled dark-blue circles) and their 95%CIs (vertical dark-blue lines).

