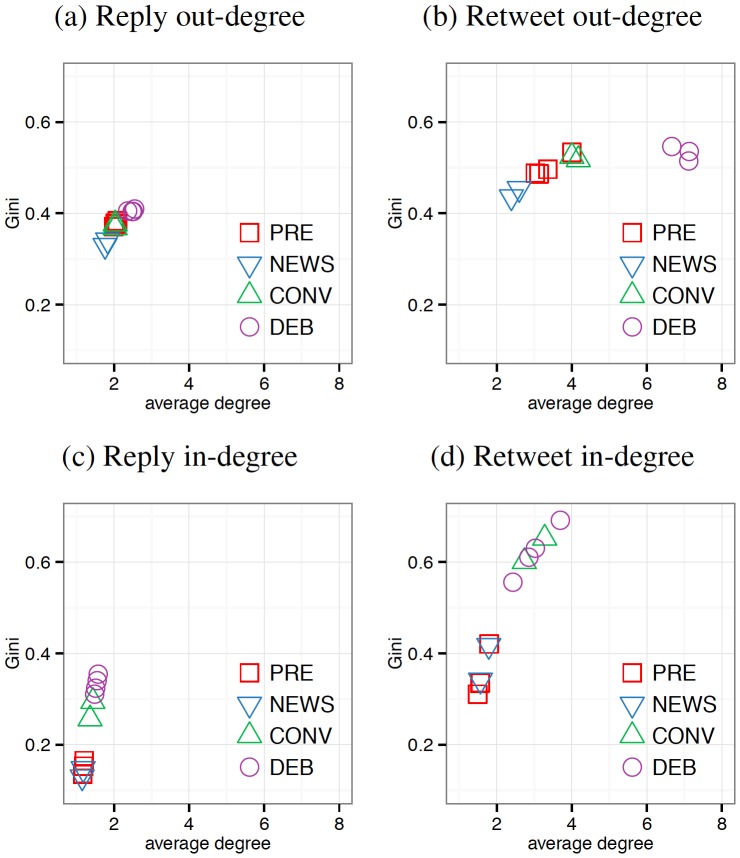
Figure 3. Connectivity-concentration state spaces.
(a,c) The out- and in-degree statistics of user-to-user reply network. (b,d) The out- and in-degree statistics of user-to-user retweet network. For each of the twelve observed events, the Gini coefficient ( -axis) measures the level of concentration of the network's degree distribution, and a lower Gini coefficient indicates a more equal distribution; the average degree of the network (
 -axis) measures average activity of everyone for the event. Across activity types, the in-degrees show consistent patterns of increasing centralization (Gini coefficient) but limited increases in average connectivity degree (average degree) in response to media events while the out-degrees show patterns of increasing degree rather than concentration in response to media events, suggesting that while users across the system become more active during media events, this additional activity predominately benefits a handful of users and tweets. (PRE: pre-debate baseline; NEWS: Benghazi attack and 47% controversy; CONV: Republican and Democratic Natl Conv; DEB: presidential debates).

