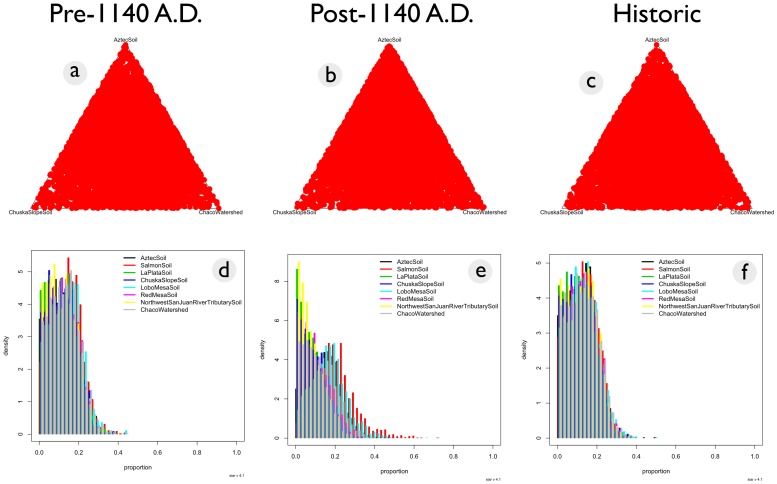
Figure 4. Ternary and proportion plots illustrating source mean posterior probabilities generated from Markov-Chain Monte Carlo simulations of strontium isotope data.
There is no clear pattern for pre-1140 A.D. (a), post-1140 A.D. (b), and historic maize (c), indicating that no source attribution is more likely than others based on this model. Mean posterior probability proportions of geochemical source contributions for pre-1140 maize (d), post-1140 maize (e), and historic maize (f) are also displayed.

