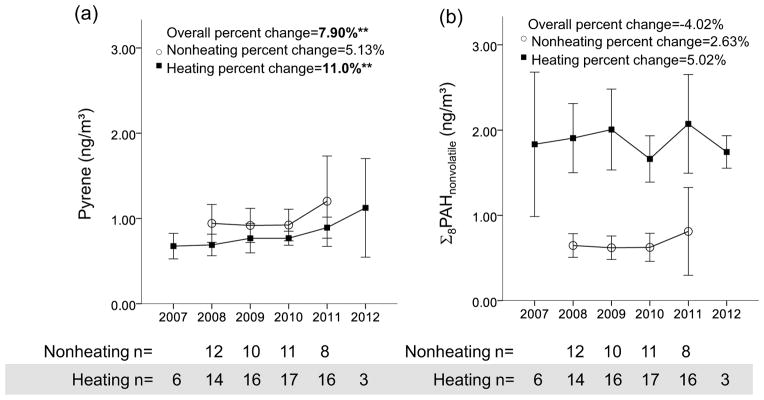
Fig. 3. Temporal trends of (a) pyrene and (b) Σ8PAHnonvolatile concentrations measured from the central site from 2007 to 2012, stratified by heating season.

Annual arithmetic mean concentrations of central site PAH levels with 95% confidence interval are presented by heating season; Linear regression modeling was used to test trends over time; The percent change in PAH concentration per year was calculated by 100*[exp(log_βadj)−1] where log_βadj expressed in log-adjusted ng·m−3/year for PAH;; boldface type indicates statistical significance with **p value <0.001.
