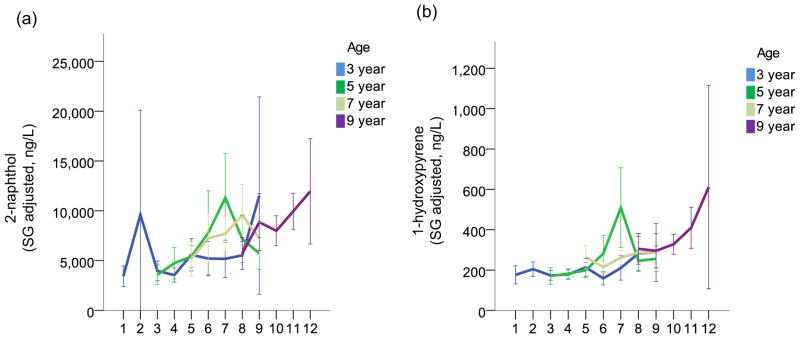
Fig. 5. Temporal trends of (a) 2-naphthol and (b) 1-hydroxypyrene concentrations in urine from 2001 to 2012, stratified by age group.

Annual arithmetic mean concentrations of specific gravity-adjusted metabolites with 95% confidence interval are presented by age group. Visual graphic representation was selected based on the significance of positive associations between year of monitoring and PAH metabolites shown in supplementary table 6.
