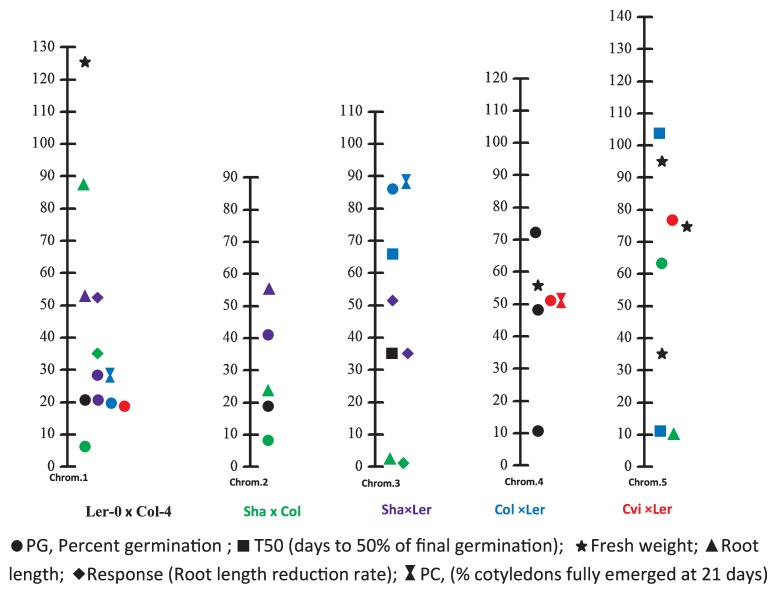
Fig. 2.
Comparison of QTLs mapped using different populations for salt tolerance in Arabidopsis. The QTLs in RIL populations Ler-0 × Col-4 (black) were detected by Quesada et al. (2002), those of Sha × Col-0 (green) and Sha × Ler (purple) were by Galpaz and Reymond (2010), and those of Col × Ler(blue) and Cvi × Ler(red) were by DeRose-Wilson and Gaut (2011).

