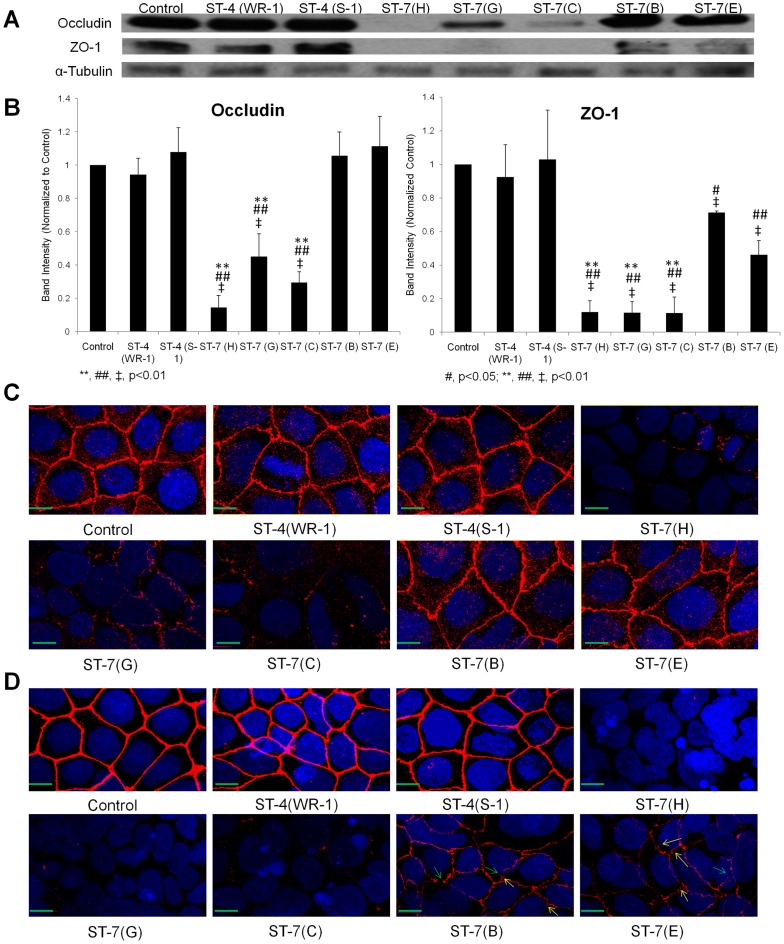
Figure 2. Differential effects on tight junction protein degradation in Caco-2 cell monolayers by different strains of Blastocystis.
(A) Representative Western blot analysis of occludin and ZO-1 level in Caco-2 epithelium. Monolayers were harvested after infection with Blastocystis ST-4 and ST-7 isolates; normal culture media was used as the negative control. No obvious change in occludin and ZO-1 was observed in ST-4-treated samples. Within ST-7, a more prominent decrease or loss of occludin band could be seen in cells treated by isolates C, G and H, while the changes in B-, E-treated cells were not obvious; for ZO-1 tight junction protein, loss of band was observed in Caco-2 cells after coincubation with ST-7 (C, G, H), whereas a decrease in band intensity was also noticed in B- and E-treated cells. (B) Quantification of tight junction levels through densitometry analysis of Western blot radiographs. Densitometric values of occludin and ZO-1 signals were quantified and expressed as the ratio to α-Tubulin. ST-4-treated samples did not differ significantly from control in occludin and ZO-1 level; ST-7 (C, G, H) induced significant occludin and ZO-1 degradation compared with ST-4 and ST-7 (B, E) isolates (p<0.01). ST-7 (B, E), however, were able to induce significant ZO-1 degradation compared with control and ST-4, but not for occludin. **, p<0.01 vs. ST-7 (B, E)-infected cells; #, p<0.05 vs. ST-4-infected cells; ##, p<0.01 vs. ST-4-infected cells; ‡, p<0.01 vs. non-infected cells. Results were from three independent experiments. Error bars represent the standard errors. (C) Representative confocal micrographs illustrating occludin integrity in Caco-2 monolayers. Caco-2 cells are labelled with DAPI (Blue) and an antibody targeting tight junction protein occludin and Cy3® goat anti-mouse IgG (Red). Corresponding with Western blot results, in ST-4 and ST-7 (B, E)-treated samples, no obvious change in occludin was observed. Infection with ST-7 (C, G, H), however, induced focal disruptions and degradation in occludin, as shown by the decreased occludin staining intensity in Caco-2 cell line. Scale bar = 10 µm. (D) Representative confocal micrographs illustrating ZO-1 integrity in Caco-2 monolayers. Caco-2 cells are labelled with DAPI (Blue) and an antibody targeting tight junction protein ZO-1 and Cy3® goat anti-mouse IgG (Red). Compared with the negative control and ST-4-treated samples, where ZO-1 appeared continuous with sharp pericellular staining patterns, all ST-7 isolates resulted in focal disruption as well as degradation of ZO-1 in Caco-2 cells. In ST-7 (C, G, H)-treated samples, ZO-1 staining almost became invisible, indicating more degradation of the protein, which corresponded with the western blot results. Notably, treatments with ST-7 (B, E) resulted in both focal disruptions (green arrows) as well as reorganizations of ZO-1 (yellow arrows). Scale bar = 10 µm.

