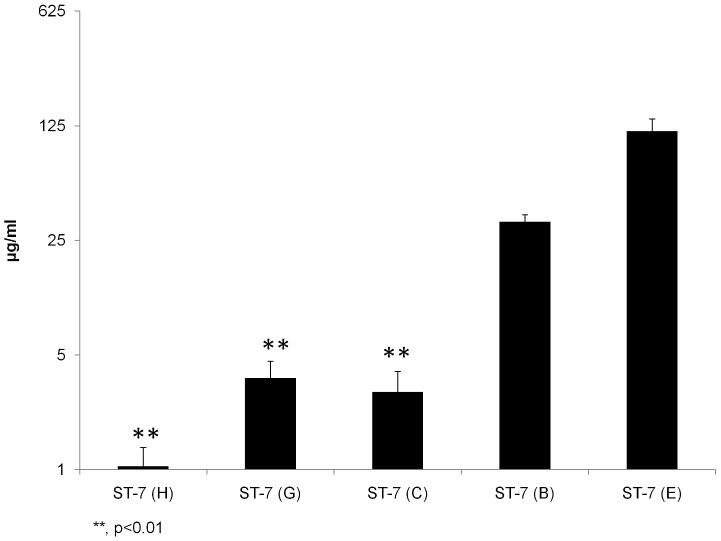
Figure 7. Blastocystis exhibits intra-subtype variation in susceptibility and resistance to Mz.
Graph representing IC50s of Mz against Blastocystis ST-4 and ST-7 isolates tested in the study using the resazurin assay. Y axis was presented on a logarithmic scale in base 5. The IC50s of Mz against ST-7 isolates C, G and H were found to be significantly lower than those of isolates B, E within the same subtype (p<0.01). **, p<0.01 vs. ST-7 (B, E). Each point represents a mean of nine readings derived from three independent experiments, triplicate each. Error bars represent the standard errors.

