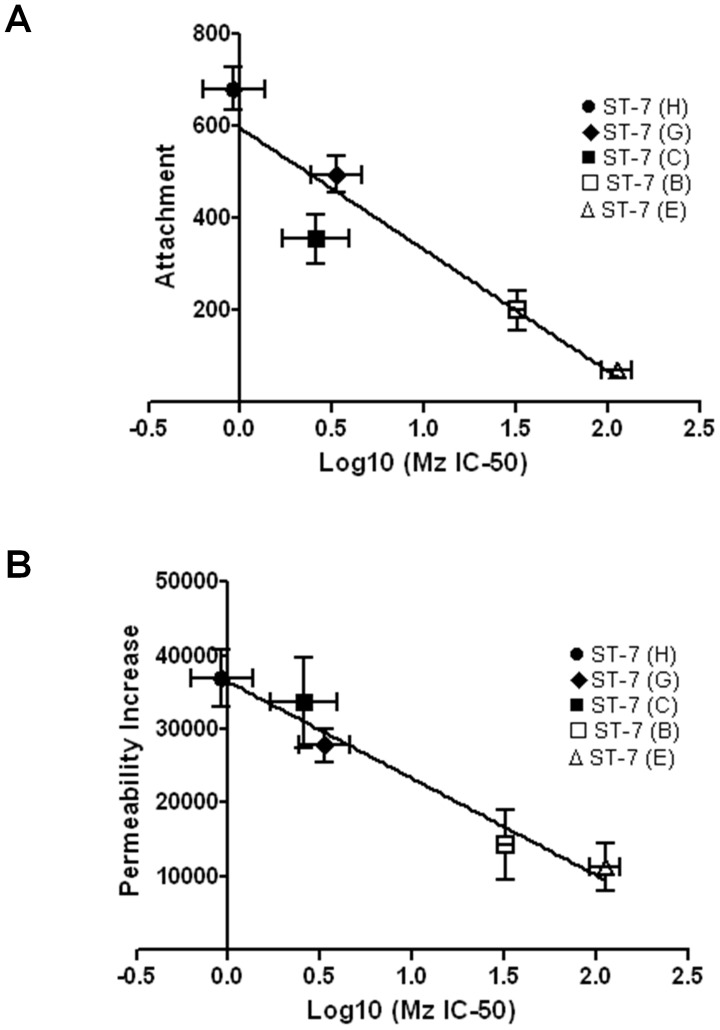
Figure 8. Correlation analyses between Mz resistance and (A) attachment, as well as (B) permeability increase in Blastocystis ST-7 parasites.
(A) Relationship between Mz resistance and attachment for Blastocystis ST-7 parasites. The data points indicate individual strains. Error bars indicate the standard error for the respective measurements (n = 3). There was a negative correlation between the level of resistance and attachment (p<0.05, R2 = 0.8908). (B) Relationship between Mz resistance of Blastocystis ST-7 parasites and their ability in inducing permeability increase. The data points indicate individual strains. Error bars indicate standard errors for the respective measurements (n = 3). There was a negative correlation between the level of resistance and permeability increase (p<0.01, R2 = 0.9644).

