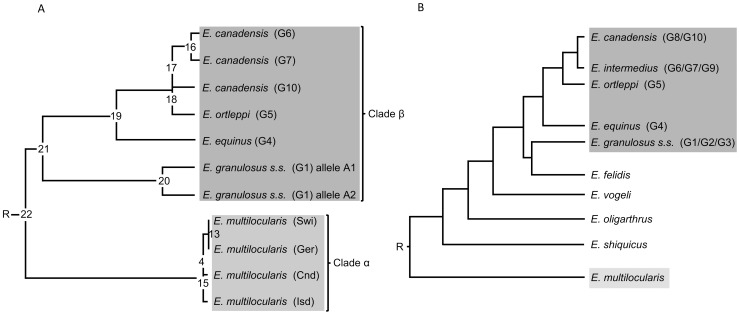
Figure 4. Comparison of phylogenies of Echinococcus inferred by maximum likelihood (ML) analysis using gDNA data.
(A) Maximum likelihood with molecular clock rooted cladogram from this study, based on p29 gene sequence (exons and introns). (B) For comparison a published cladogram based on the DNA sequences of nuclear protein-coding genes is shown [38].

