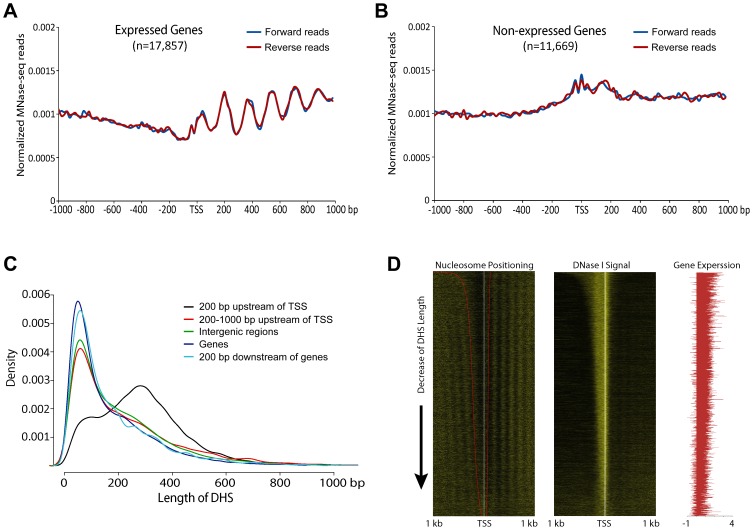
Figure 2. Phased nucleosome arrays flanked TSSs of rice genes.
(A) Nucleosome positioning profile associated with active genes. Phased nucleosome arrays are detectable after the TSSs. (B) Nucleosome positioning profile associated with non-expressed genes. Phased nucleosome arrays are detected on either side of the TSSs. (C) Distribution of DHS length for five different DHS categories. Note: the length of DHSs associated with proximal promoters (black line) are more variable than the lengths of other DHSs. (D) Heatmap of nucleosome positioning associated with active genes. Left panel: All expressed genes were sorted by the length of DHSs located in proximal promoters. The 5′ ends of the MNase-seq reads were mapped within 1 kb upstream and 1 kb downstream of the TSS of each gene to show the boundaries of nucleosomes core and linker. The red line on the left heatmap indicates the boundaries of DHSs. With the same order of the genes as in the left panel, the 5′ ends of DNase-seq reads (middle panel) and the fragments per kilobase of exon per million fragments mapped (FPKM) value log10 transformation (right panel) were mapped to show the DNase I sensitivity and the expression level of each gene, respectively.

