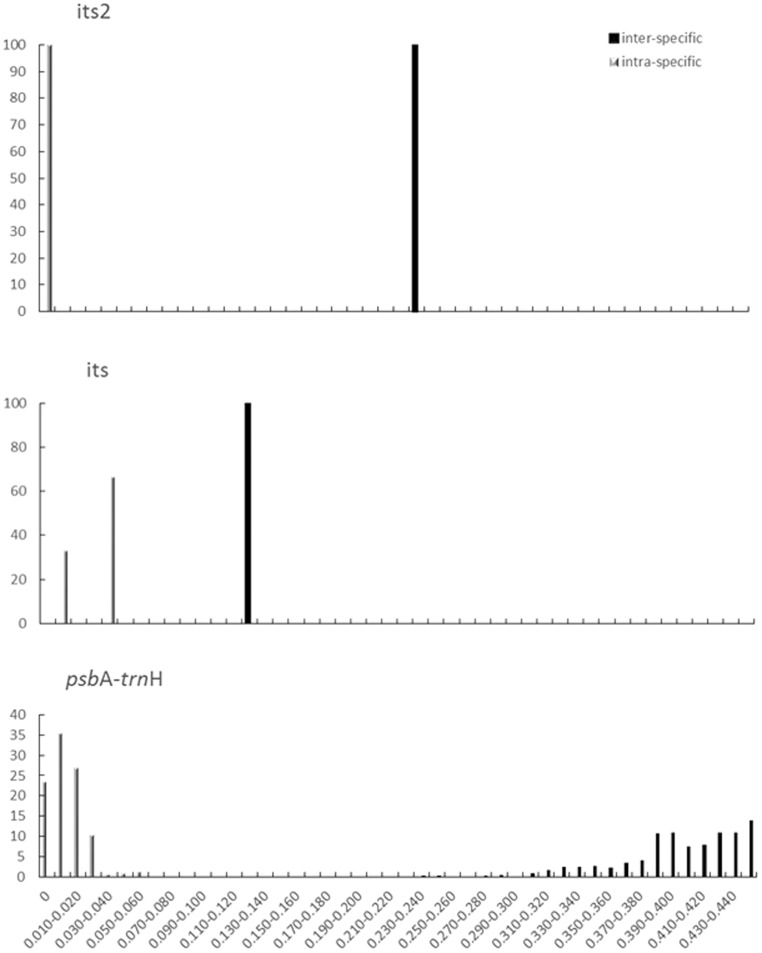
Figure 5. Relative distribution of inter-specific divergence and intra-specific variation in three barcodes.
Three barcodes of ITS2, ITS, psbA-trnH were analyzed for relative distribution of inter-specific divergence and intra-specific variation between C. deserticola and C. tubulosa based on the K2P genetic distance.

