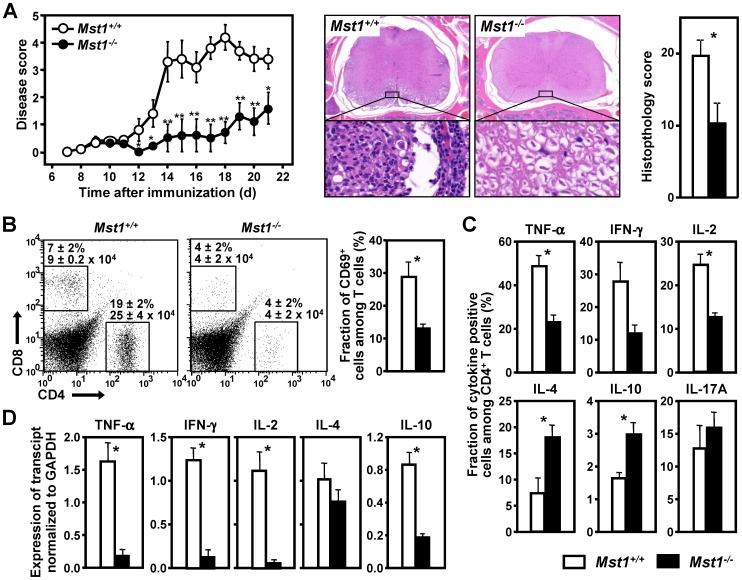
Figure 7. Mst1−/− mice are resistant to EAE.
(A) EAE was induced in mice of indicated genotype (n = 10) by immunization with MOGp35–55 in CFA. The mean EAE score ± SEM observed in each group is plotted against time after immunization (left panel). Representative H&E stained sections of the cervical spinal cord of WT and Mst1−/− mice obtained on day 21 after immunization (middle panels). Higher (×40) magnification shows areas of prominent mononuclear multifocal inflammation, vacuolization and gliosis in the white matter of WT mice, which are nearly absent in Mst1−/− mice. Aggregate histopathology scores were obtained on day 21 after immunization (right panel). Similar data were obtained in two additional independent experiments. * (p<0.05) and ** (p<0.01) indicate significant differences in comparison to WT animals (Mann–Whitney U test). (B) Infiltrating mononuclear cells were isolated from the spinal cord of mice with the indicated genotype (n = 5/group) on day 15 after immunization with MOGp35–55, and analyzed by flow cytometry for markers of T cell differentiation and activation. Numbers above the rectangular gates represent the percentages and absolute numbers (x104/spinal cord) of infiltrating CD4+ and CD8+ T cells for each genotype. (C) Frequency of IL-2-, TNF-α-, IFN-γ-, IL-4-, IL-10, and IL-17A-producing CD4+ T cells infiltrating the spinal cords of indicated mice was measured by flow cytometry analysis of intracellular cytokine staining. (D) qPCR analysis of IL-2, TNF-α, IFN-γ, IL-4, and IL-10 mRNA in the spinal cords from mice of indicated genotype (n = 6–10) was performed on day 11 after immunization with MOGp35–55. Values are expressed relative to the expression of GAPDH. Values and statistical significance are expressed as in Fig. 2 and represent at least two independent experiments.

